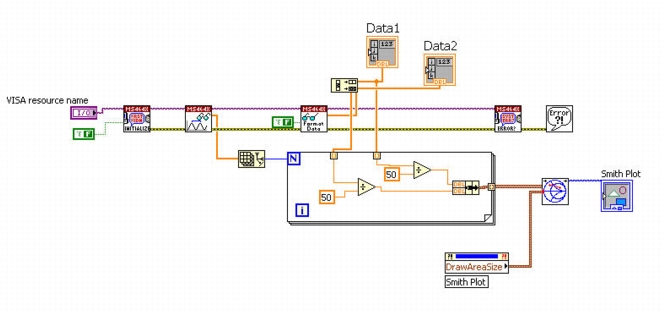
This example is similar to the previous example except here we need to make sure that the active channel is set to Smith Chart (or do an optional instrument reset which sets up smith charts on trace 1 and 4). Although we don’t need the frequency data to display the smith chart, we use the Read Frequency Values VI to get the frequency list and then grab the data count from the number of frequencies. This data count is passed to the For Loop control.
By default Trace1 is set to output impedance values. Smith chart actually takes a normalized impedance (normalized to 1) so we divide the impedance/reactance pairs by 50 (ohms) to get normalized smith chart data.
Example 6 – Block Diagram – Smith Chart
We again use Read Frequency Values, but here we get the Formatted Data for the active channel (which is a Smith Chart).
Use the Frequency Array to get the number of points and feed that into the For Loop control. The Channel Data from the Active Trace is Impedance/Reactance so we divide by Z0 (or 50 ohms, hardcoded here) to get the smith chart data.
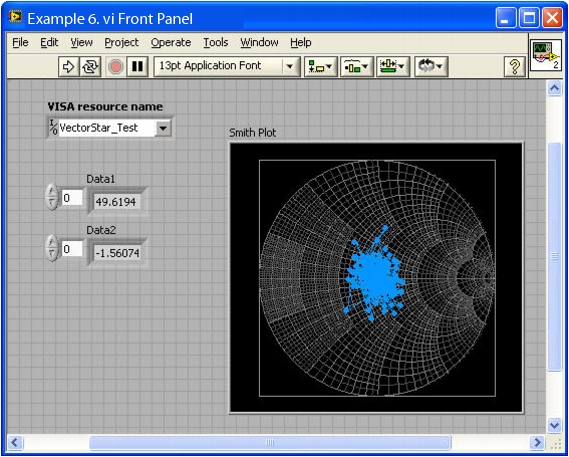
Example 6 – Front Panel Display and Resultant Smith Chart
Front Panel Display.
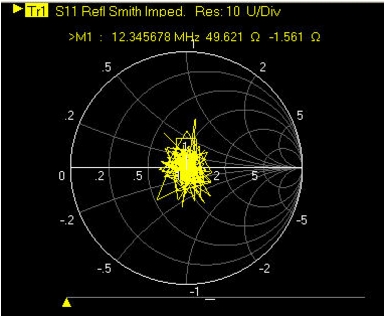
Example 6 – VectorStar Smith Chart Trace 1 Display