Example 6 and 6a– Smith Chart Data
Example 6 – Acquire Smith Chart Trace Data
This example is similar to the previous example except here we do an instrument reset which sets up Smith Charts on Trace 1 and 4. The code snippet is below.
//==============================================================================
//
// Title: Example 6
// Purpose: Acquire Trace Data
//
// Created on: 11/30/2011 by David Judge.
// Copyright: Anritsu. All Rights Reserved.
//
//==============================================================================
//==============================================================================
// Include files
#include <ansi_c.h>
#include <visa.h>
#include <userint.h>
#include <formatio.h>
#include "au464x.h"
ViSession session;
ViStatus checkErr (ViStatus status);
#define CHECKERR(fCal) \
if (au464x_status = checkErr((fCal)), au464x_status < VI_SUCCESS) \
goto Error; else
int main (int argc, char *argv[])
{
ViInt32 retCount;
ViStatus status;
ViUInt32 read_count;
ViStatus au464x_status = VI_SUCCESS;
FILE* fp;
ViChar readBuffer[500000];
ViReal64 fdata[201];
ViReal64 chanData[402];
ViReal64 impData[201];
ViReal64 reactData[201];
int i, ii = 0;
CHECKERR(au464x_init ("VectorStar_Test", VI_FALSE, VI_TRUE, &session));
CHECKERR(au464x_SetSweepPoints (session, 1, 201));
CHECKERR(au464x_SetTraceCount (session, 1, 1));
CHECKERR(au464x_SetTraceFormat (session, 1, 1, AU464X_TRACEFORMAT_SMIT));
CHECKERR(au464x_SetTracesLayout (session, 1, AU464X_DISPLAYLAYOUT_R1C1));
CHECKERR(au464x_GetFrequencyList (session, 1, fdata, 201 , &retCount));
CHECKERR(au464x_GetFormattedData (session, 1, chanData, 402,&retCount));
au464x_close(session);
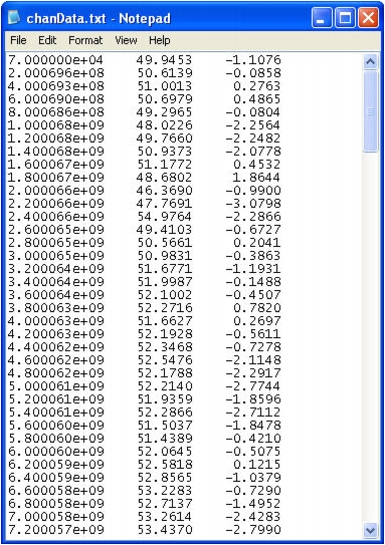
fp = fopen(".\\chanData.txt","w") ;
for (i=0;i<201;i++)
{
impData[i] = chanData[ii++];
reactData[i] = chanData[ii++];
fprintf(fp,"%e %10.4f\t%10.4f\n",fdata[i],impData[i],reactData[i]);
}
fclose(fp);
Error:
printf("\n\nHit return to exit:");
getc(stdin);
return 0;
}
ViStatus checkErr (ViStatus status)
{
ViChar error_message [256];
ViUInt32 read_count;
ViChar error_buffer [1024];
ViInt32 my_error_code = 0;
ViInt32* error_code = &my_error_code;
ViUInt16 stb;
ViUInt16 VNA_ERROR = 4; //This means there is an error
ViUInt16 VNA_ERROR_MSG = 16; //This means there is a message in the error buffer(4+16)
if (status >= 0)
viReadSTB (session, &stb);
//check if stb & VNA_ERROR is set
if (status < VI_SUCCESS | | (((stb & VNA_ERROR) > 0) && ((stb & VNA_ERROR_MSG) > 0)))
{
au464x_writeInstrData (session, ":SYST:ERR?");
viRead (session, (ViPBuf)error_message, 256, &read_count);
SetWaitCursor (0);
sprintf (error_buffer, "Instrument Error: %s\n", error_message);
printf ("%s\n", error_buffer);
au464x_writeInstrData (session, "*CLS");
}
return status;
}
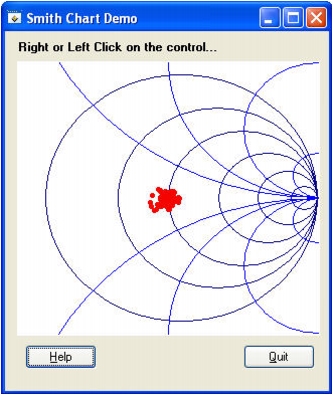
Example 6a – Smith Chart Output
Next we modify Example 6 to use the built-in smith chart control. This program is adapted from the Smith Chart Demo in samples\apps\smithchart. We use the smithchart fp found in toolslib\toolbox\smith.fp." We set Trace 1 to Smith Chart and to output impedance values. Most Smith chart controls actually take a normalized impedance (normalized to 1) so we divide the impedance/reactance pairs by 50 (ohms) to get normalized smith chart data. The code snippet is below.
ViInt32 retCount;
ViStatus status;
ViUInt32 read_count;
ViStatus au464x_status = VI_SUCCESS;
ViReal64 fdata[201];
ViReal64 chanData[402];
ViReal64 impData[201];
ViReal64 reactData[201];
int i, ii = 0;
CHECKERR(au464x_init ("VectorStar_Test", VI_FALSE, VI_TRUE, &session));
CHECKERR(au464x_SetSweepPoints (session, 1, 201));
CHECKERR(au464x_SetTraceCount (session, 1, 1));
CHECKERR(au464x_SetTraceFormat (session, 1, 1, AU464X_TRACEFORMAT_SMIT));
CHECKERR(au464x_SetTracesLayout (session, 1, AU464X_DISPLAYLAYOUT_R1C1));
CHECKERR(au464x_GetFrequencyList (session, 1, fdata, 201 , &retCount));
CHECKERR(au464x_GetFormattedData (session, 1, chanData, 402,&retCount));
au464x_close(session);
for (i=0;i<201;i++)
{
impData[i] = chanData[ii++];
reactData[i] = chanData[ii++];
gZ.Real = impData[i]/50.0;
gZ.Im = reactData[i]/50.0;
SMITH_PlotImpedancePoint(panelHandle, PANEL_GRAPH, &gZ, VAL_SOLID_CIRCLE,
IMPEDANCE_COLOR);
}
1-800-ANRITSU
10450-00008, Rev. L