 | |
Index | Description |
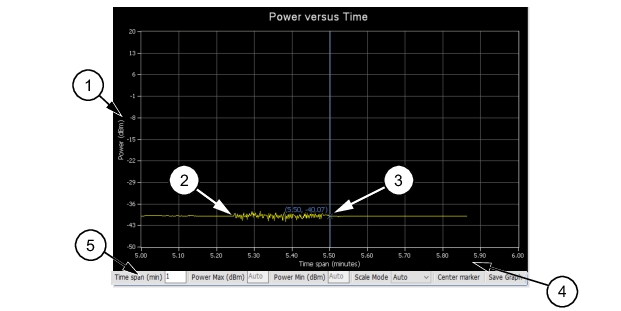
1 | The vertical scale displays the power level in dBm, regardless of the Units settings of dBm, μW, mW, or W from the Continuous Mode settings area. |
2 | Graphical trace display showing the power level as a function of time. |
3 | Marker showing as a vertical blue line with an x on the marker point and numerical values for the time (in minutes) and power level (in dBm). The marker is available for reading power at an instant of time. It can be dragged with the mouse and can be centered in the display via the Center marker button. |
4 | The horizontal scale displays the time in minutes and may be increased or decreased from the graticule settings area. This scale increases up to a maximum of 1440 minutes. |
5 | Graticule settings area: Time Span (min): Sets the current time span setting from 0.1 minutes up to a maximum of 1440 minutes. Power Max (dBm): Sets upper power level for the vertical scale. Not available when set to Automatic. Power Min (dBm): Sets lower power level for the vertical scale. Not available when set to Automatic Scale Mode: Sets the vertical scaling to Automatic or Manual. Center marker: Set the cursor to the center of the graticule and displays the center (x, y) parameters. Save Graph: Opens the save dialog. Saves the currently shown graph data into a .csv file Settings are applied by pressing the Enter key |