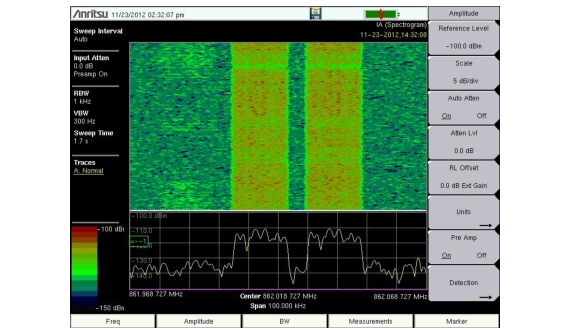
A Spectrogram is a three dimensional representation of frequency, time and power useful for identifying intermittent interference. Color is used to represent power levels.
Required Equipment
• An antenna that is appropriate for the frequency range to be measured
Required Setup
• Place the instrument in Interference Analyzer mode.
• Connect the antenna to the RF In test port.
Procedure
The following procedure demonstrates one example of an Interference Analyzer Spectrogram setup.
1. For the most effective spectrogram display, press the Amplitude main menu key, press the Reference Level submenu key and set the reference level such that the largest signal to be displayed is near the top of the spectrum analyzer area of the screen. The reference value required can be determined by observing the color of the highest signal and changing the reference level to place that value near the top of the spectrum analyzer area.
2. Press the Scale submenu key and set the scale value to place the lowest signal near the bottom of the screen. In general, 4 dB/division or 5 dB/division are good starting values.
3. Press the BW main menu key and set Auto RBW and Auto VBWOn, or set the applicable RBW and VBW values by pressing the RBW and VBW submenu keys.
4. Press the Measurements main menu key, then the Spectrogram submenu key to display the spectrogram. Press the Spectrogram key again to open the Spectrogram Menu.
5. To change the time between sweeps, press the Sweep Interval submenu key and use the rotary knob or keypad to set the time from 0 seconds to 60 seconds.
Note
If Sweep Interval is set to a value > 0, a message is displayed instructing you to set the selected trace to Max Hold, Min Hold, or Average, which determine how multiple measurement traces are compressed into one spectrogram trace. This allows extended measurement times to be set, either with the result on one screen or when recording without running out of mass memory.
6. The instrument can be set so that spectrogram plots are automatically saved when the display is full. Press the Record submenu key to toggle saving On or Off.
7. When Record is set to On, the Recording Time submenu key is displayed. Press this submenu key to set how long the instrument will record the spectrogram before stopping.
8. The Time Cursor submenu key is used to turn on the horizontal time cursor. Use the up or down arrow key to move the cursor vertically through the spectrogram. The date and time that the measurement at the cursor position was taken is displayed at the top of the screen.
Note
When the Time Cursor is activated and is not on the zero trace position, the instrument will automatically stop making measurements.
9. Press the Marker main menu key to place up to six markers on the signal and display the power and frequency at each marker position.
Note
Screen captured images are provided as examples. The image and measurement details shown on your instrument may differ from the examples in this Measurement Guide.