Application Notes To measure return loss at Port 1 (or Port 2), use the Log Mag display with S11 (or S22). To measure the gain or loss in a DUT that is connected between Port 1 and Port 2, use the Log Mag display with S21 or S12. |
Application Notes To measure return loss at Port 1 (or Port 2), use the Log Mag display with S11 (or S22). To measure the gain or loss in a DUT that is connected between Port 1 and Port 2, use the Log Mag display with S21 or S12. |
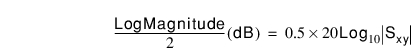 |
Application Note For measuring 1‑port cable loss, use S11 or S22 with the Log Mag / 2 display type to account for the round trip signal path through the cable. When using reflection data to measure cable loss, the end of the cable must be shorted or must be a perfect open. |
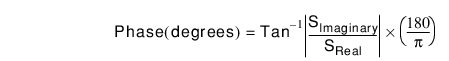 |
SReal = Real S‑parameter SImaginary = Imaginary S‑parameter |
Application Note SWR, or Standing Wave Ratio, is a measure of the reflection from the DUT input port or output port, and it must be used, therefore, with S11 or S22. |
Group Delay (sec) = rate of change of phase over a specified frequency aperture |
Application Note Group Delay is a measure of the time delay of the signals that are propagating through the DUT versus frequency (using S21 or S12). Group delay is a good measure of phase distortion through the DUT. |
Smith Chart = graphical tool for plotting impedance or admittance data versus frequency |
Application Note Use Smith Chart with S11 or S22 to plot the input or output impedance of the DUT. Use the Inverted Smith Chart to plot admittance data. Note: The Inverted Smith Chart is available only on VNA Master models MS20xxC. |