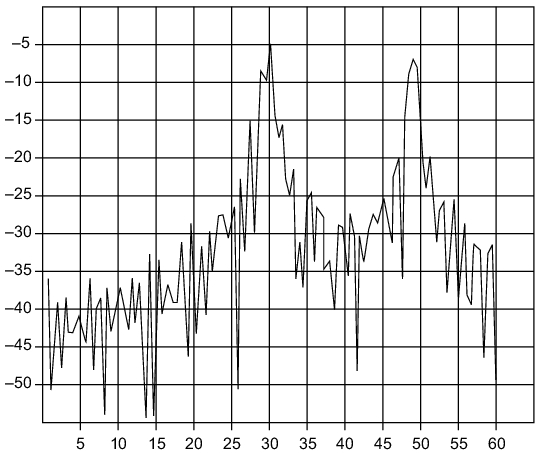
This Distance To Fault graph has Return Loss (dB) on the vertical scale (y‑axis) and distance in feet on the horizontal scale (x‑axis).
This view of Rectangular Windowing shows the maximum side lobe display and the greatest waveform resolution.
Nominal Side Lobe Windowing
Nominal Side Lobe Windowing Example
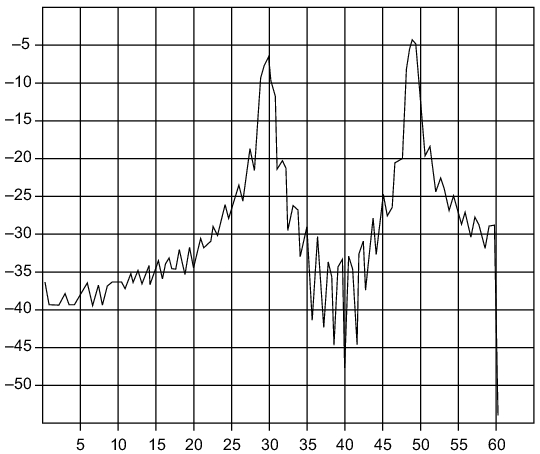
This Distance To Fault graph has Return Loss (dB) on the vertical scale (y‑axis) and distance in feet on the horizontal scale (x‑axis).
This view of Nominal Side Lobe Windowing shows less side lobe resolution than Rectangular Windowing and more side lobe resolution than Low Side Lobe Windowing. This level of windowing displays intermediate resolution.
Low Side Lobe Windowing
Low Side Lobe Windowing Example
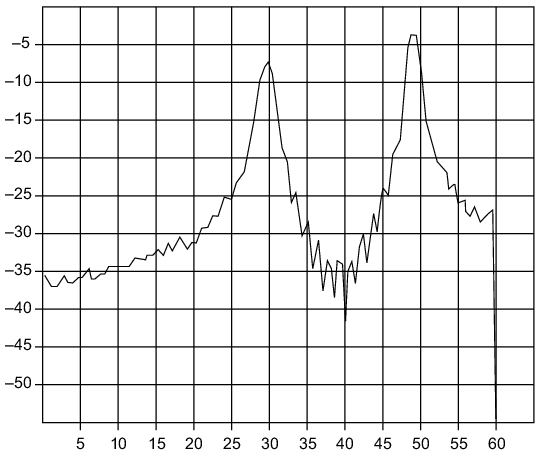
This Distance To Fault graph has Return Loss (dB) on the vertical scale (y‑axis) and distance in feet on the horizontal scale (x‑axis).
This view of Low Side Lobe Windowing shows less side lobe resolution than Nominal Side Lobe Windowing and more side lobe resolution than Minimum Side Lobe Windowing. This level of windowing displays intermediate resolution.
Minimum Side Lobe Windowing
Minimum Side Lobe Windowing Example
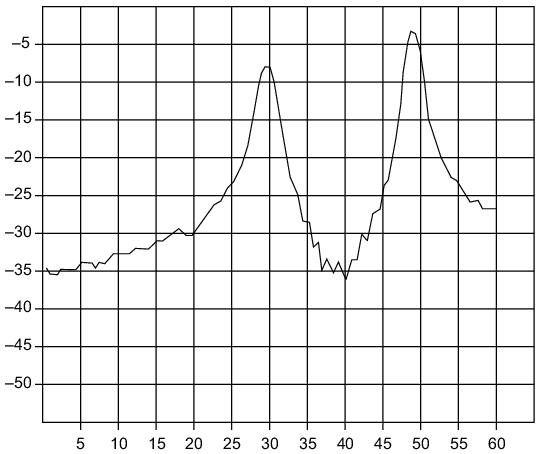
This Distance To Fault graph has Return Loss (dB) on the vertical scale (y‑axis) and distance in feet on the horizontal scale (x‑axis).
This view of Minimum Side Lobe Windowing shows less side lobe resolution than Low Side Lobe Windowing and displays the lowest side lobe and waveform resolution.