 |
|
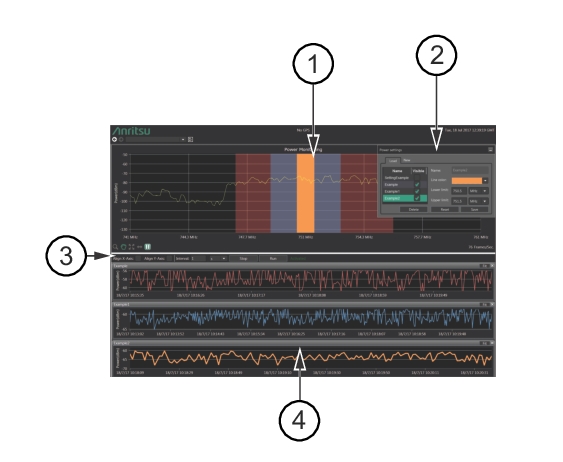
Number & Title | Definition |
1 Spectrum Chart | Browse through the spectrum using the mouse by simply dragging the displayed spectrum chart. Every defined power display will be displayed as well with its corresponding color. |
2 Power Settings | This window maintains the power display settings. The New tab allows you to create a new power monitoring area. The Load tab allows you to use any previously saved power monitoring setup. It can be dragged around or minimized. If previously created Power Setting files were saved, settings of the first fill will be displayed in the Load panel. Otherwise, the Load panel will be empty. |
3 Power Display Controls | • Align-X-Axis: Aligns every power chart to the x-axis of the longest running power display measurement • Align-Y-Axis: Aligns every chart to the y-axis according to the global minimum and the global maximum power of every chart • Interval: Defines the interval when the power display should be updated. • Run/Stop: Start or stop the measurement |
4 Power Charts Over Time | Every defined power area will be displayed in this section. |