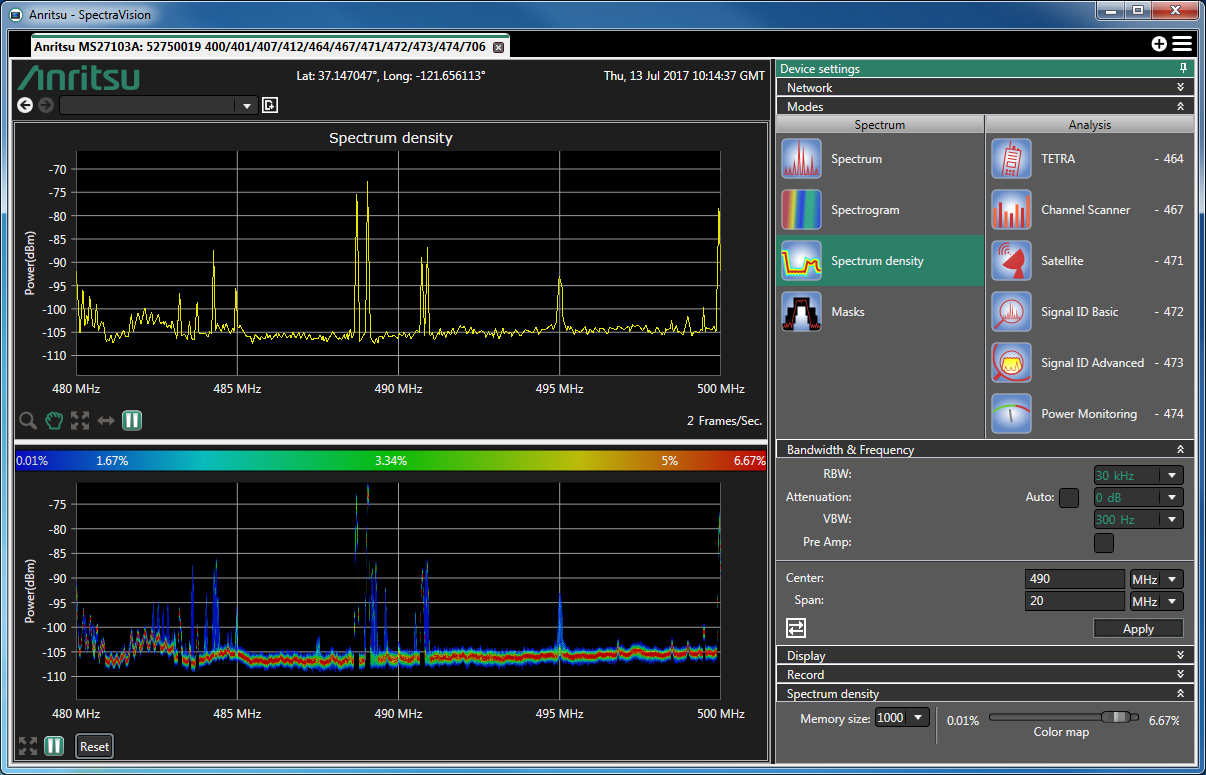
The following screen provides the spectrum density mode working pane.
Spectrum Density Display
Spectrum Settings
The spectrum settings are the same as in the spectrum mode (See General Setup). The following instructions are for creating maps used in setting the Spectrum Display parameters.
Click Spectrum Density in the Mode Panel. The Spectrum Density display opens and the Spectrum Density panel opens.
Spectrum Density Setup
The number of spectra considered in the spectra density increases the spectrum counter. If the counter exceeds the memory size, new spectra will be generated. Hence, elder events are lost over time.
The color map assigns a color range to a range of occurrence probabilities (given in percentage) for the captured power level values. By increasing the memory size, larger probabilities are also displayed. The level of color details will adapt automatically in the spectrum density chart.
Spectrum Chart
You can scroll/browse through the spectrum using the mouse by simply dragging a displayed spectrum chart.
Spectrum Chart Controls
The spectrum chart controls are the same as in the spectrum mode.
Color Map Bar
The color map is displayed according to the current setting. It shows the color values assigned to the specified occurrence probabilities in percentage.
Spectrum Density Chart
The quality of the occurrence probabilities improves for the power level values with an increasing number of captured spectrums. Starting with an empty pane, the level of color details will increase in a spectrum density chart over time until the memory size is reached. Then, a “persistence” or “after glowing” effect can be observed. The reason is that a probability value will disappear from the screen when it reaches a certain threshold. In addition, the coloring is strongly influenced by the chosen color map. You can scroll/browse through the spectrum density using the mouse by simply dragging a displayed chart.
Spectrum Density Chart Controls
• Fit to screen: Resets the frequency and amplitude axis according to the spectrum chart.
• Reset: Resets the spectrum density and starts drawing a new chart.
• Continue/Pause: Continue, default, continually collects trace data. Pause or freezes the chart at a desired time instant.
Note
Sporadic spectrum events, which last shorter than the sweep time of the remote spectrum monitor cannot be captured. Hence, such rare, time-varying signals are not covered using a spectrum density measurement.