The TDOA user control provides a quick means to include TDOA measurements in a host program.
The TDOA user control can be configured several ways to provide the right level of detail and simplicity needed in a host application. Many of the display components can be hidden to provide a basic interface with few options and simple execution. If more control is sought, then various pieces can be added to the UI independently to provide just what is wanted.
Several display combinations are shown. Not all combinations are included, but all of the elements are shown in some configuration.
All optional UI components can be made visible or hidden at design-time by setting properties in the visual editor. There is a View button in the button bar that can be hidden or visible. If this button is visible, then users can control which components they have access to at run-time.
Basic User Interface (UI)
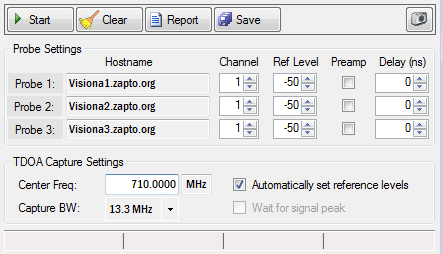
The basic UI provides a minimum set of control to do a TDOA measurement. This includes setting the Hostname for the probes to be used, along with the center frequency and bandwidth of the target signal. You also can turn on/off the preamps in each probe and optionally set the reference level, or have Vision TDOA automatically set the reference level for you. In the example below, example host names are used for each of the 3 probes. Use your own URL or IP address in your application.
Basic User Interface
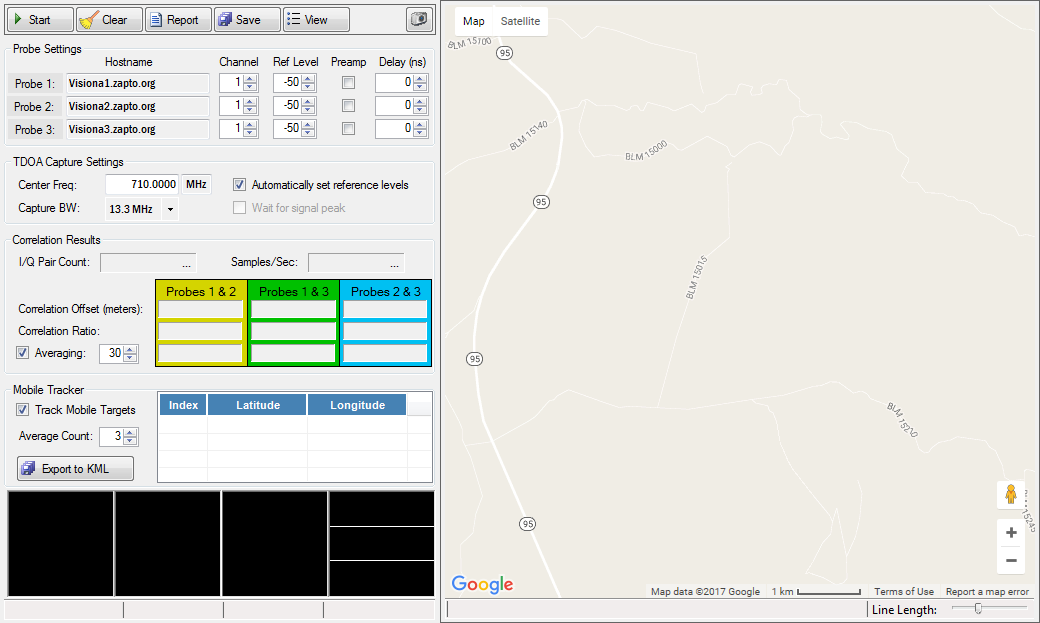
Correlation Results and Map
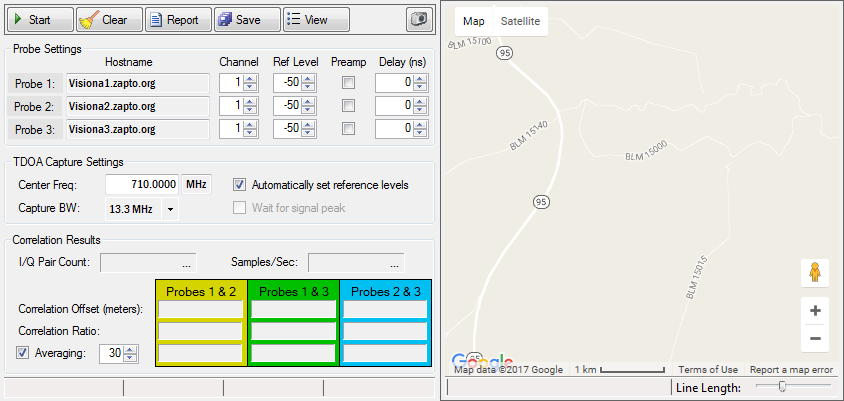
Correlation results are not necessary and many users new to TDOA will not know how to interpret them. These results can be hidden to simplify the interface.
In most cases, showing the map will be desirable. The map is crucial to visualizing the TDOA output. However, you can hide the map display.
Correlation Results and Map
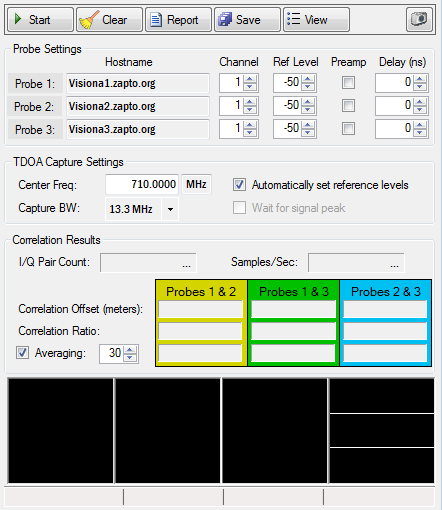
Correlation Results and IQ Graphs
I/Q graphs can be shown. The I/Q diagram is very useful for interpreting the validity of the data captures. The graphs, when visible, can contain either the raw I/Q data or show a trace sweep for each I/Q data capture.
Correlation Results and IQ Graphs
Moving Target Tracking
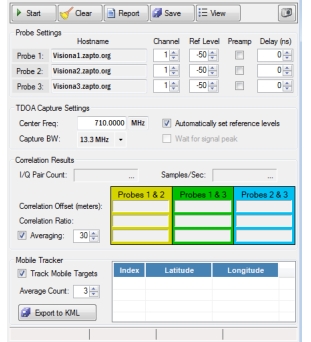
In the image below, the Tracking option is enabled. With Tracking enabled, results are repeatedly calculated and added to a table after the run is complete. The results in the table can be exported to a KML file. KML files are useful for importing tracks to mapping programs.
Tracking Option Enabled
Full User Interface
All optional components enabled. The View button in the button bar can be disabled (as shown in the Basic UI below). When this is enabled, users can turn on each UI component as they wish. To truly restrict users to a predefined configuration, the View button must be hidden in the development stage.