 |
|
Save | Saves the current I/Q capture data to a disk file. |
Open | Loads a saved I/Q Capture file into the Radio Monitor program. A file may take a few seconds to several minutes to load. For wide bandwidth capture files, the file is split into time slices and FFT’s are used to get back the RF sweep for each time slice. Once the file is open, the trace data will be displayed and selecting a frequency in the trace graph will allow you to listen to an AM or FM signal at any frequency within the larger I/Q capture. |
Refresh | Reloads the file header for the currently opened I/Q Capture file, if one exists. This button resets the parameter fields to match the loaded I/Q Capture file. |
Volume Up | Increases the volume. |
Volume Down | Decreases the volume. |
Screenshot | Takes a picture of the Radio Monitor control and copies it to the Windows Clipboard. |
Help | Opens online Help. Only visible if a file is assigned using the HelpFile property. |
Button | Description |
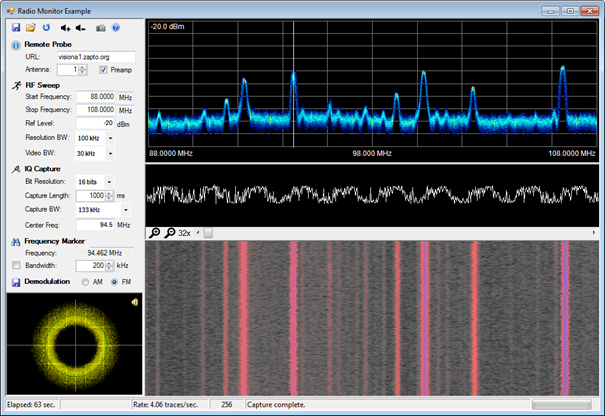
Remote Probe: The Remote Probe button captures basic system information for the designated probe.  | |
RF Sweep: The RF Sweep button starts collecting traces from the target receiver and draws them in a density plot. The Sweep parameters specified in the section under this button are first sent to setup the sweep measurements. | |
I/Q Capture: The I/Q Capture button captures I/Q data from the target receiver. The bit resolution, capture length, bandwidth and center frequency are set according to the input fields below this button. | |
Frequency Marker: The Frequency Marker button does a peak search in the RF Sweep window and sets a marker at the peak power position. The Frequency is shown in the box below this button. The marker can also show a width that can be used to determine the appropriate I/Q capture bandwidth for a peak of interest. | |
Demodulation: The Save Demodulation button causes the most recently played AM/FM demodulation sound to be saved to a WAV file. Click the AM or FM radio buttons to select the demodulation mode. |