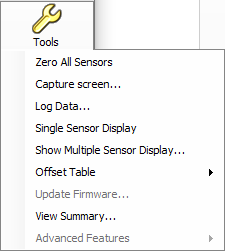
Zero All Sensors provides a convenient method of zeroing all connected sensors. Zero all sensors before making power measurements. If frequent low-level measurements are being made, it is advised to often check the sensor zeroing to assure accurate measurements. Before zeroing the sensor, connect it to the DUT (device under test) test port and remove RF power from the connection to a level 20 dB below the noise floor of the power sensor. For the MA24103A and MA24105A, this level is less than –20 dBm. For the MA24108A, MA24118A, MA24126A, MA24208A, MA24218A and MA243x0A, this level is less than –70 dBm. For the MA243x1A, this level is –67 dBm. Leave the sensor connected to the DUT test port so that ground noise and thermal EMF (electro-magnetic fields) are zeroed out of the measurement. The sensor may also be connected to a grounded connector on the DUT.
Capture Screen
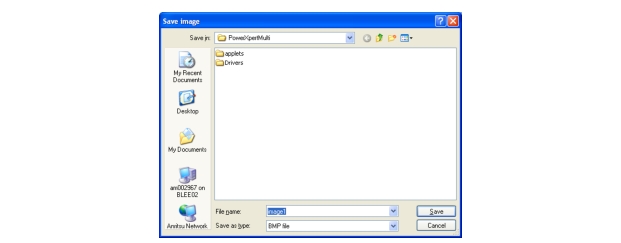
The Capture Screen utility captures a PowerXpert screenshot and displays the Save image dialog that allows you to save the image in BMP, JPEG, PNG, or GIF file formats.
Save Image Dialog
Log Data
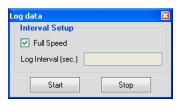
The Log Data feature provides the ability to record data in a comma separated value file and is accessed from the Tools | Log Data toolbar. This feature is available only when the application is in Continuous Average mode. Data logging is set up in the dialog below:
Log Data Dialog
• Interval Setup: Sets full speed data or fixed interval data logging (user defined logging interval). When Full Speed is selected, the user must manually start and stop the logging function.
• Log Interval (sec.): Type the time interval in which to log data when Full Speed is deselected.
Note
Log Interval should be set to reduce the number of data points when capturing long time periods as Microsoft Excel has a limitation of data records.
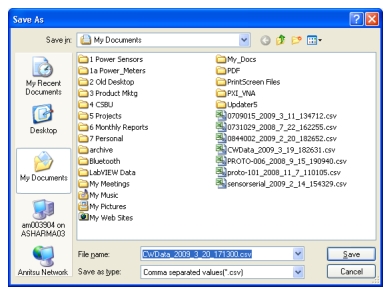
Data is stored as comma separated value (.csv) files that can be directly opened in Microsoft Excel. The filename and location can be selected or changed as desired. The default filenames have the following format:
Test_yyyy_mm_dd_hhmmss.csv
where:
• yyyy: Four-digit year
• mm: One- or two-digit month
• dd: One- or two-digit day
• hhmmss: Two digit hours (24-hour clock), minutes, and seconds
The Save As dialog is shown when the Start button is pressed.
Log Data Save As Dialog
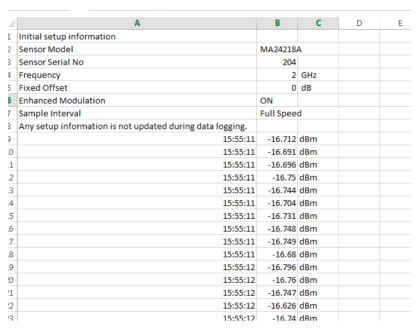
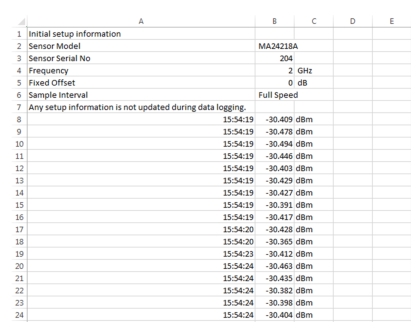
Sample log data is shown in a Microsoft Excel spreadsheet file below:
Log Data Enhanced Modulation On
Data logging is stopped by accessing the Tools | Log Data toolbar and pressing Stop in the Log data dialog.
Log Data Enhanced Modulation Off
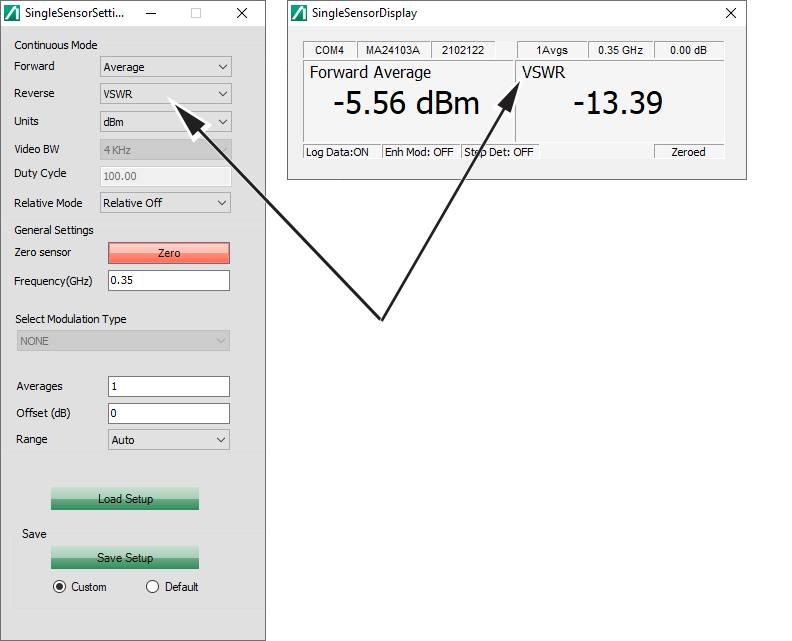
Single Sensor Display
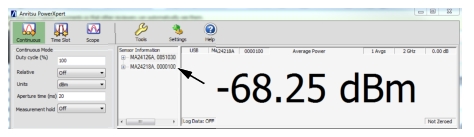
Used with the MA24103A only. Provides a real-time power measurement display along with the Continuous Mode control panel. The Power vs Time screen and the Apply Settings button are not available in this mode. Parameter changes made in the Continuous Mode control panel are applied and displayed in real time in the Single Sensor Display panel as shown in Figure: Single Sensor Display. The MA24103A power measurement parameters can be changed in the Continuous Mode panel and the resulting measurements are displayed in real time in the Single Sensor Display window.
Single Sensor Display
Load Setup
Press the Load Setup button to show the Windows stored file location dialog. Click the file to load.
Save Setup
Press the Save Setup button to display the Windows save dialog.
Custom
Create a folder/file location to set as a custom file location. When the Save Setup button is pressed, files will be stored in this custom location.
Default
Loading the PowerXpert program creates a default file location in the users PC for the MA24103A.
"C:\Users\<xxxx>\AppData\Local\Anrtisu\PowerXpert\" where <xxxx> is the users personal PC identification.
When the Save Setup button is pressed, files will be stored in this default location. The default settings are launched when PowerXpert is opened. The default setting files can be shared with other users.
Show Multiple Sensor Display
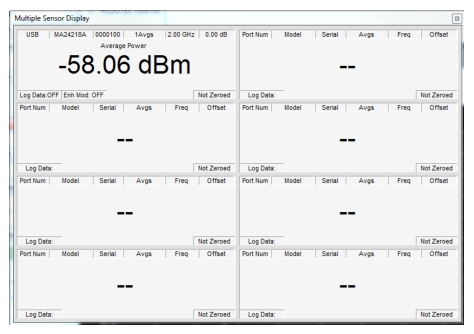
PowerXpert offers a Multiple Sensor Display screen that can show simultaneous measurements of up to eight sensors. This display is in addition to the normal PowerXpert display and is enabled by clicking Tools | Show Multiple Sensor Display. The measurements in the Multiple Sensor Display may differ from the measurements displayed in the numerical display area. The Multiple Sensor Display measurements are accomplished in a multi-threading process while the measurements in the numerical display area are performed.
PowerXpert Multiple Sensor Display
When using multiple sensors, the sensor parameters are applied to the selected sensor in the Sensor Information area.
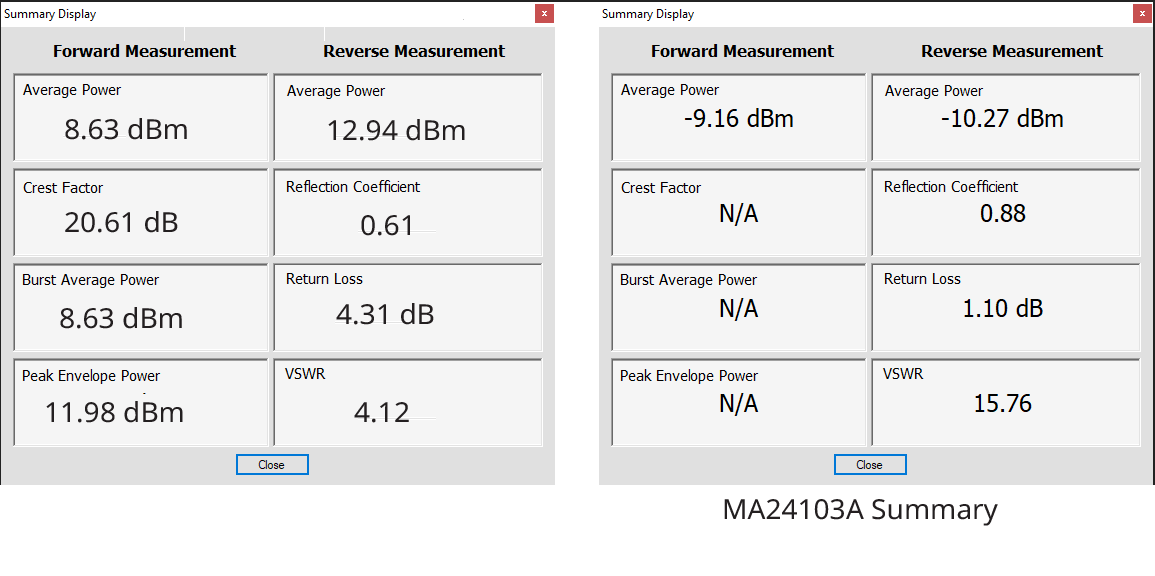
This display, is enabled by clicking Tools | View Summary. The measurements in the Summary Display may differ from the measurements displayed in the numerical display area. The Summary Display measurements are accomplished in a multi-threading process while the measurements in the numerical display area are performed.
View Summary Screen
Offset Table
Offset Table feature is only available with the MA24106A power sensor. Offset table provides the ability to apply corrections to measurements when RF devices are used between the sensor and DUT. Different from Fixed Offset, Offset Tables allows you to enter different offset values at different frequencies for an RF device. The frequency response of that device needs to be known before the offset corrections can be entered. Offset Table employs linear interpolation to determine offset values for intermediate frequencies. In cases where the cal factor frequency is higher than the highest frequency in the offset table, then the offset for the highest frequency in the table is used. Similarly, when the cal factor frequency is lower than the lowest frequency in the offset table, then the offset for the lowest frequency in the offset table is used.
Offset Table Setup
The procedure for setting, saving, recalling, and applying the offset table is as follows:
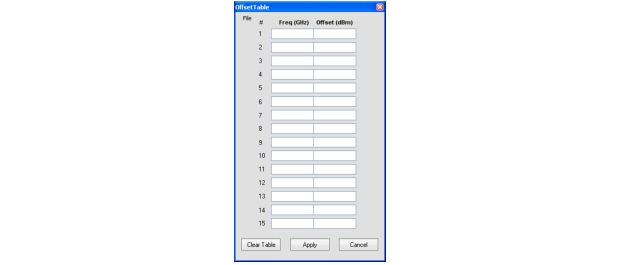
1. Click Tools | Offset Table | Setup.
Offset Table
2. In the resulting dialog enter the frequency response of the RF device manually or by importing an S2P file used to measure the DUT.
Note
Positive values in dB are used for attenuation.
3. Click Apply in the Offset Entry screen to correct the measurement. “Offset table applied” appears briefly in the display window indicating that an offset table correction is applied to the current measurement. Also, a check mark is applied in front of the Enable Offset Table selection in the Tools | Offset Table menu.
4. To clear all of the entries in the table, click the Clear Table button.
5. Save the response of the device by clicking Save from the Offset Entry Screen and save as a file in the directory of your choice. Any number of device responses can be stored. The files are stored as comma separated value files (.csv).
6. To recall a response, click File | Open in the Offset Table dialog, select the file, and then click Apply. Similarly .s2p files can be imported by selecting File | Import .s2p file in the Offset Table dialog.
7. To remove the offset table correction, click Tools | Offset Table | Enable Offset Table. to remove the check mark. “Offset table disabled” appears briefly in the display window indicating that an offset table correction is no longer applied to the current measurement.