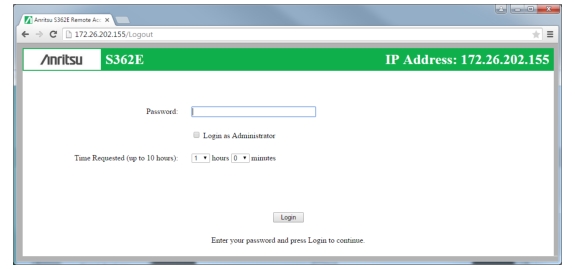
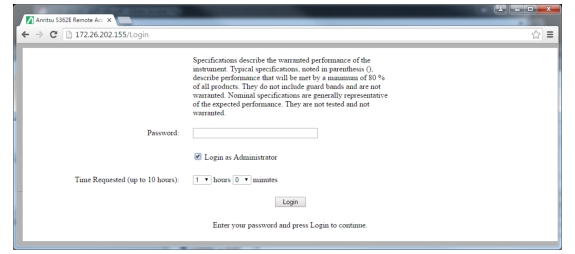
The Web Remote Control Login page opens following browser connection to the instrument. See Figure: Login Page. The page may show or hide certain elements depending on device management options set by the Administrator, as described in Device Options.
Login Page
User Login
To start a remote session with a test instrument:
1. Enter the instrument IP address in the Google Chrome address bar. The instrument must be connected via Ethernet as described in Setup.
2. Use the pull-down menus on the Login page to set the time, in hours and minutes, before the remote session times out. The default session time is 1 hour, with a 10‑hour maximum.
Only one user at a time can connect to the instrument. To avoid locking out other users unnecessarily, do not reserve a longer session than you need.
3. To enable functions available only to the network administrator, select the Login as Administrator checkbox.
4. Enter the instrument password, then click Login.
The default administrator password is “Admin” with a capital A. The default password for other users is None; that is, leave the field blank.
If another user already has control of the instrument when you try to log in, a message will display indicating the instrument is currently reserved by another client, whose IP address is listed with the time remaining in their session.
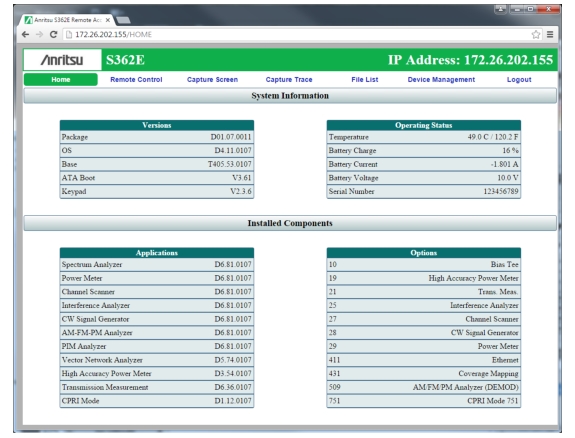
Following login, the Web Remote Control Home page is displayed.
Home Page
The Web Remote Control Home page lists the same information as what is displayed on the instrument screen when you press Shift, System (8) at the front panel, followed by the Status menu key.
At the top of the page, a green banner shows the instrument model number and IP address. If the instrument has been assigned a name, this name is displayed in the center of the banner.
The menu bar below the banner consists of tabs for commands and links: Home, Remote Control, Capture Screen, Capture Trace, File List, Device Management, and Logout.
Web Remote Control Home Page
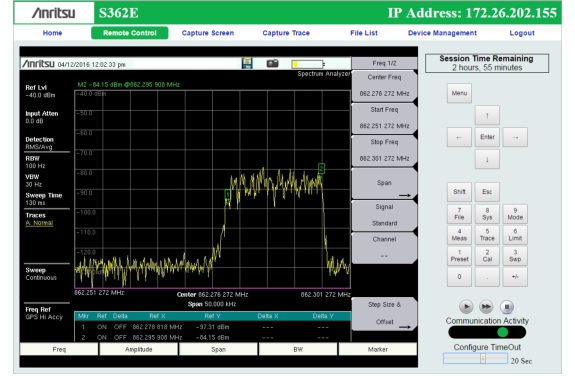
Remote Control
The Remote Control page displays a bitmap image of the instrument screen. The buttons on the right of the display reflect the layout of the buttons on the instrument and are used to access the same monitoring and control functions. See Figure: Remote Control Page.
Remote Control Page
Note
• When clicking a key or measurement icon on the Remote Control page, a small green dot appears at the point of the cursor to indicate that the key, button, or icon was pressed.
• A single Web-enabled device can monitor and control multiple instruments. However, multiple Web-enabled devices with different IP addresses cannot connect to the same instrument simultaneously.
Session Time Remaining
This is the amount of time remaining before your remote session automatically terminates. The session time is reserved at login. It can be changed on the Device Management page.
Normal Mode
Normal Mode is the default mode, where the bitmap image of the instrument screen is continually refreshed in the browser window. Click the single arrow button near the bottom right of the page to return to Normal Mode from either Fast or Pause Mode. Clicking any tab on the menu bar also returns to Normal Mode.
Fast Mode
Click the double arrow button to enter Fast Mode, where the update rate can be significantly faster than Normal mode, especially over low bit-rate connections. Only the measurement data (yellow trace) is continually updated. The main menu keys and submenu keys may look different than in Normal Mode, but their functions are the same. Error messages are not shown in Fast Mode.
Fast Mode is not available with some Spectrum Analyzer measurement types, in which case the Fast Mode button is disabled. The button is not displayed when the measurement mode is something other than Spectrum Analyzer.
While in Fast mode, if a measurement type is selected that Fast mode does not support, the instrument will return to Normal mode.
Pause Mode
Clicking the Pause button turns the Communication Activity dot in the lower right-hand corner to yellow. If the interface was in Normal Mode, this stops the instrument display from refreshing in the browser window. If the interface was in Fast Mode, the trace measurement stops updating. Click the single arrow or the double arrow button to resume remote communications with the instrument in Normal or Fast Mode, respectively. The Communication Activity dot then returns to green.
Communication Activity
The moving dot labeled Communication Activity, when green, indicates that ongoing communication is occurring between the instrument and PC. When you click Home, Capture Screen, Capture Trace, File List, Device Management, or Logout on the menu bar, the Communication Activity dot briefly turns yellow before the selected page opens in the browser.
Configure Timeout
If the Ethernet connection is poor and you expect frequent lags in response time, you can increase the timeout up to 20 seconds, before the instrument sends an “Instrument Busy” message. The default timeout is 3 seconds.
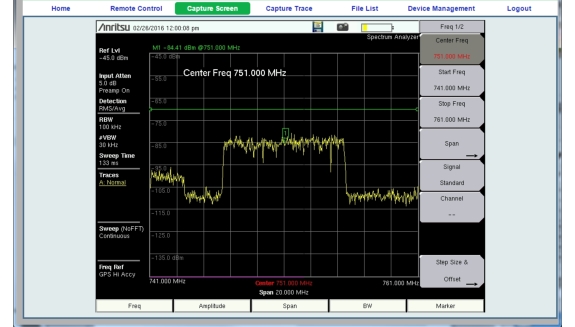
Capture Screen
Captures a JPEG image of the current instrument display and saves it directly to internal memory. A file name is automatically created using the current date and time stamp. The captured display is loaded to the browser page, under the menu bar. See Figure: Capture Screen Page. In Windows, you can right-click on the screen image and select Copy. With iOS, press and hold on the picture. This makes it easy to create documentation using screen captures.
Capture Screen Page
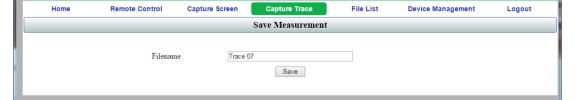
Capture Trace
Opens an input dialog to enter a name for the trace to be saved. See Figure: Capture Trace Page. After clicking Save, a confirmation dialog opens to indicate the trace was successfully saved to the instrument.
Capture Trace Page
Depending on the browser and operating system used, different prompts may appear. Some operating systems like iOS may not support file saving from a browser.
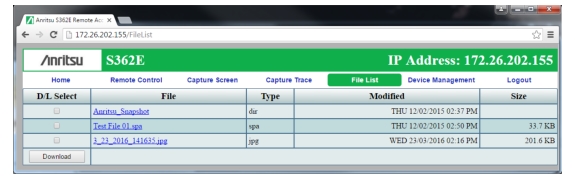
File List
Displays the list of folders (type “dir”) and files contained in the instrument's internal memory. See Figure: File List Page. To view the contents of a folder, click on the folder name.
File List Page
To download a file, click the file name. Alternatively, you can select the checkbox on the left of the file name, then click Download. You may also select the checkboxes of multiple files and/or folders and download them together, as a zipped folder. In this case, a pop-up dialog box shows the estimated download time. Press OK to continue.
Note
Some operating systems, like iOS, do not support file downloads.
Depending on the browser and operating system, the download function may allow you to open the file or save it, or both. In Google Chrome, for example, the downloaded file or files are automatically saved to the designated folder on your computer, such as the Downloads folder. In the banner at the bottom of the browser window, click a downloaded item to open it.
If the selected item is a single file, the file will open in the default application for the file type. For example, a JPEG file will open in the computer's default image viewer, while a measurement file will open in Master Software Tools (MST), provided the application is installed.
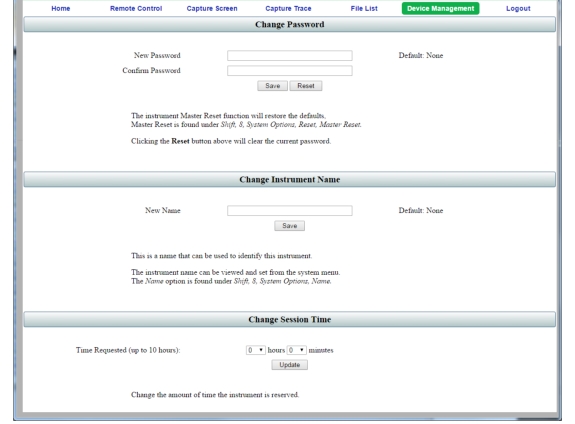
Device Management (not as Administrator)
Click the Device Management tab on the menu bar to set or clear the instrument password, to assign a device name to the instrument, or to change the session time. See Figure: Device Management Page.
If you logged in as Administrator, the Device Management page has additional sections for viewing the remote access log and for setting device options. Refer to Device Management (Administrator).
Password
If no password is set, which is the factory default, remote access to the instrument is unrestricted and any user who knows the instrument IP address can connect to it, provided the device isn’t currently reserved by another client. When a password is set, it is required upon login. To clear the current password, click the Reset button. This password is different from the administrator password described under Device Management (Administrator).
Device Management Page
Instrument Name
The instrument name, if defined, is displayed in the green banner at the top of the page. It is useful in identifying the instrument when you have more than one instrument connected. The name can be assigned remotely from this Device Management page, or it can be set from the instrument's System Options menu. Note that this instrument name is not a "hostname" as used in an Ethernet router.
Session Time
Use the pull-down menus to select the time, in hours and minutes, before the remote session times out. Click Update to reset the session timer at the specified duration. At the end of the selected time period, a message notifying the user that the session has expired will display.
Session Expired
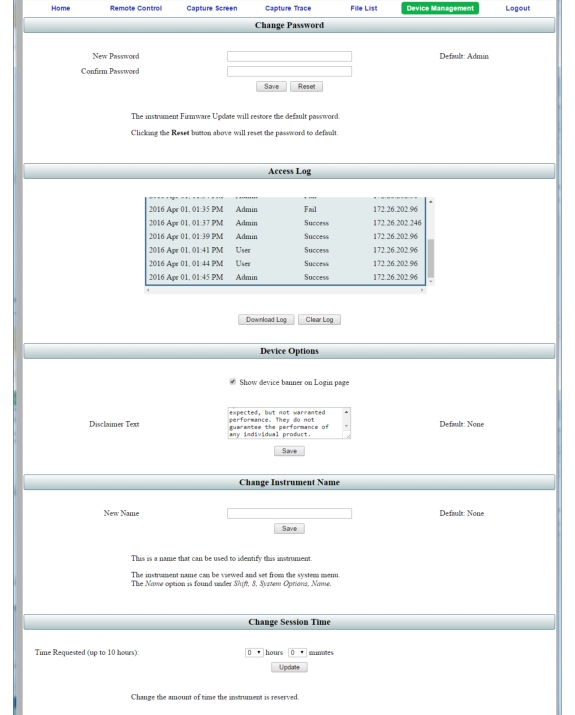
Device Management (Administrator)
Logging in as Administrator gives you access to additional functions associated with the instrument’s remote connection log and the display of information on the Login page.
Device Management Page (Administrator)
Administrator Password
A password is always required to log in as Administrator. The password is case-sensitive, with “Admin” as the factory default. To change the password, type your new entry twice and click Save. See Figure: Device Management Page (Administrator).
To restore the default password, click the Reset button. The administrator password is also reset to default each time you update the instrument firmware.
Access Log
The Access Log is viewable only when you are logged in as Administrator. It contains the date and time, success or failure status, and user information for up to 50 most recent login attempts. To save a copy of the log to the default download location on your control device, click Download Log. The saved file is a comma-delimited CSV file that can be opened with an application like Microsoft Excel. Click the Clear Log button to empty the Access Log.
Note
Some operating systems, such as iOS, do not support a user-accessible file system. Consequently, the download function is not possible if your control device is an Apple iPhone, for example.
Device Options
When logged in as Administrator, you have the option to turn on or off the optional text message and the green banner on the Login page.
For security reasons, for example, you may not want the instrument IP address to display during login. To hide the banner, deselect the Show device banner on Login page checkbox. See Figure: Device Management Page (Administrator). After changing the Show/Hide setting, click OK in the Banner Visibility message box. You may need to scroll the browser page to bring the message box into view.
To add a disclaimer or any other message to the Login page, enter the appropriate text in the text box under the Device Options section of the Device Management page, then click Save. See Figure: Device Management Page (Administrator). Click OK in the update status message box (Figure: Disclaimer Text Update Status). You may need to scroll the browser page to bring this message box into view.
Disclaimer Text Update Status
Figure: Login Page with Optional Text and No Banner shows an example of optional text on the Login page. To remove the message, delete it from the Disclaimer Text box on the Device Management page and click Save, then OK.
Instrument Name
The instrument name function is the same whether you are logged in as Administrator or as a regular user. Refer to Instrument Name.
Session Time
The session time is set in the same manner, whether you are logged in as Administrator or as a regular user. Refer to Session Time.
Logout
Exits Web Remote Control and displays the Login page. To start a new session, enter the password if required, then select the session time and click Login.
Note
If you close the Web Remote Control browser window without logging out, there may be a slight delay before the instrument is released. During this time, connection attempts by other users will fail.