The following measurements are available in NB‑IoT Mode:
• NB‑IoT Summary
• Channel Spectrum
• Spectral Emission Mask
NB‑IoT Summary
1. Press the Measurements main menu key.
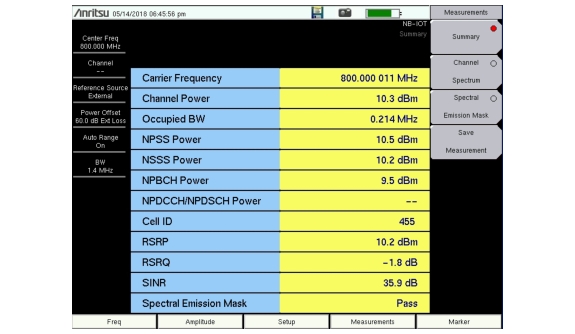
2. Press the Summary key to display the NB‑IoT measurement results in table format. See Figure: NB-IoT Summary.
The Summary table displays these values:
Carrier Frequency
Carrier Frequency is the measured transmitter operating center frequency.
Channel Power
Channel Power measures the average power within the selected bandwidth. It is expressed in dBm or Watts, based on the currently selected Amplitude units.
Occupied BW
The measured Occupied Bandwidth is calculated as the bandwidth containing 99% of the total integrated power within the selected span around the selected center frequency.
NB-IoT Summary
NPSS Power
This is the average power measurement of the Narrowband Primary Synchronization Signal.
NSSS Power
This is the average power measurement of the Narrowband Secondary Synchronization Signal.
NPBCH Power
This is the average power measurement on the Narrowband Physical Broadcast Channel.
NPDCCH/NPDSCH Power
This is the average power measurement on the Narrowband Physical Downlink Control Channel or the Narrowband Physical Downlink Shared Channel.
Cell ID
Cell identifying information sent by the transmitter in the sync signal.
RSRP
Reference Signal Received Power is the average power of Resource Elements (RE) that carry cell-specific Reference Signals (RS) over the entire bandwidth.
RSRQ
Reference Signal Received Quality provides additional information when RSRP is not sufficient to make a reliable handover or cell reselection decision. RSRQ is the ratio between RSRP and RSSI, measured in dB.
SINR
Signal‑to‑Interference-plus-Noise Ratio is measured in dB.
Spectral Emission Mask
This is the overall Pass/Fail status of all spectral emission mask segments.
Channel Spectrum
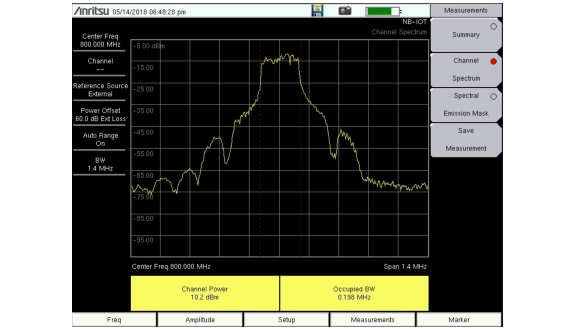
Channel Spectrum displays the spectrum of the input signal across one channel. The Channel Power and Occupied BW are computed and displayed below the graph.
1. Press the Measurements main menu key.
2. Press the Channel Spectrum key to display the spectrum of the input signal.
3. To select the frequency span, press the Span menu key and choose the desired bandwidth from the displayed list box, then press Enter. In NB‑IoT, the optimal span for spectrum view is usually 1.4 MHz.
Span List Box
4. To return to the Measurements menu, press Back.
NB-IoT Channel Spectrum Display
The RF Channel Spectrum summary table is displayed at the bottom of the trace window.
Channel Power
Channel Power measures the average power within the selected bandwidth. It is expressed in dBm or Watts, based on the currently selected Amplitude units.
Occupied BW
The measured Occupied Bandwidth is calculated as the bandwidth containing 99% of the total integrated power within the selected span around the selected center frequency.
Spectral Emission Mask
The Spectral Emission Mask measurement supports the testing for “Operating Band Unwanted Emissions” described in the 3GPP TS 36.141 Base Station Conformance testing document.
The measurement results indicate if the signal is within the limits set in the 3GPP specification. The spectral emission information for each mask segment is displayed in a table, which you can show or hide.
1. Press the Measurements main menu key.
2. Press the Spectral Emission Mask menu key to activate the Spectral Emission measurement and open the menu.
3. Select Spectral Emission Mask Category A.
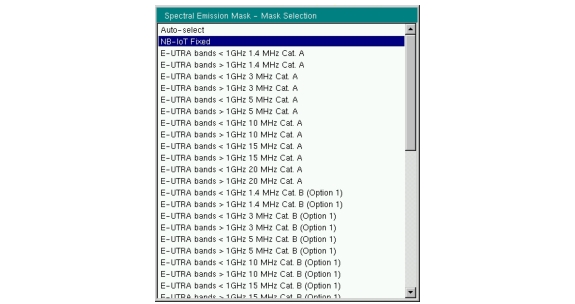
4. Press Select Mask and choose NB‑IoT Fixed from the displayed list.
Spectral Emission Mask List Box
5. To show or hide the Summary table of Spectral Emission measurement results, press the Summary Table submenu key to toggle the setting on or off.
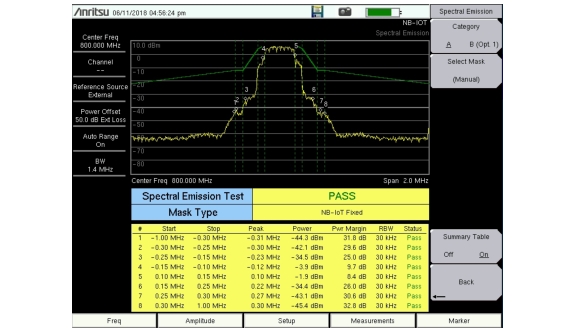
NB-IoT Spectral Emission Mask Display
6. Press the Back key to return to the Measurements menu.
Markers in the spectrum display are placed at the peak amplitude locations within the mask segments, as defined by the 3GPP specification. See Figure: NB-IoT Spectral Emission Mask Display. The measurement status is returned as a Fail when the marker value is above the mask line in any of the mask segments.
The Summary table displays the following measurement results for each numbered mask segment:
Start, Stop, Peak – These are the start, stop, and peak frequencies in the mask segment.
Power – This is the peak amplitude in the segment.
Pwr Margin – Power Margin is the difference between the mask line, as specified in the 3GPP standard, and the marker value.
RBW – Is the Resolution Bandwidth.
Status – The measurement status is Pass if the peak power is within the 3GPP-specified limit, that is, the marker does not exceed the displayed mask line.