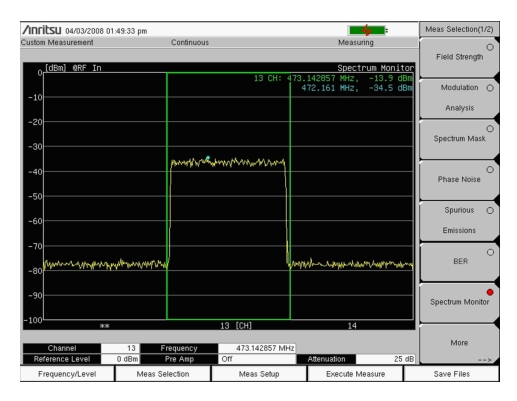
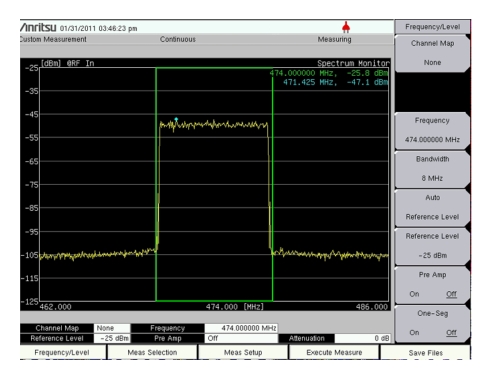
The Span setting selects the number of channels to display on the measurement screen (graph). The channel (when 1CH is selected in Span) is the channel that was selected in the Frequency/Level menu (refer to section Frequency and Reference Level Configurations and to Step 2 and substep Step b). You can use that menu to change the channel number. When multiple channels are displayed (by using the Span setting), the channel number that is selected in the Frequency/Level menu is displayed as the center channel.
The channel number, the channel frequency, and the power level are displayed in green in the graph. The frequency and power level at the blue diamond marker are displayed in blue in the graph. The blue diamond marker always denotes the peak level within the green zone.
Test Setup:
1. Press the Meas Setup main menu key to open the Meas Setup menu to configure the following parameters: Measure Mode, Span, and Zone Position.
2. Press the Meas Mode submenu key to open the Select Meas Mode list box.
Use the Up/Down arrow keys or the rotary knob to highlight the desired measurement mode and then press Enter. Choose from: Single and Continuous.
3. Press the Span submenu key to open the Select Span list box.
Use the Up/Down arrow keys or the rotary knob to highlight the desired number of channels to span, and then press Enter. Refer to Table: Span Options with Associated RBW, VBW, and Detection Parameters for the RBW, VBW, and Detection parameters for each Span setting. The values that are shown in this table are set internally and are not displayed on the instrument screen.
Span Options with Associated RBW, VBW, and Detection Parameters
Span
RBW
VBW
Detection
1 CH
10 kHz
3 kHz
RMS
3 CH
10 kHz
10 kHz
RMS
5 CH
10 kHz
30 kHz
RMS
11 CH
10 kHz
30 kHz
RMS
31 CH
10 kHz
100 kHz
RMS
51 CH
1 MHz
300 kHz
RMS
4. Press the Zone Position to Center submenu key to set the current zone marker (green rectangle) to the center of the screen.
5. Press the Execute Measure main menu key to begin testing.
6. Save measurements to file by pressing the Save Files main menu key. Refer to the section, Saving the Measurement Results for more information regarding saving files.