|
1.
|
|
2.
|
|
3.
|
Press the Frequency/Level main menu key and then press the Channel Map submenu key to select a Channel Map (UHF, IF, None, or UHF (Brazil).
|
|
4.
|
If you selected a Channel Map of UHF or UHF (Brazil), then press the Channel submenu key to open the Channel Editor dialog box and select a channel number.
|
|
5.
|
Press the Meas Setup main menu key to open the Meas Setup menu and configure the available parameters.
|
Four additional submenu keys are displayed for Channel Map UHF (Brazil): Filter Selection, Filter Data, Corrected Data, and UnCorrected Data.
|
6.
|
|
7.
|
The mask types that are available depend upon the Channel Map that was selected in the Frequency/Level menu. To select a mask type, use the Up/Down or Left/Right arrow keys or use the rotary knob to highlight a list entry, then press Enter. The Type B Spectrum Mask is illustrated in Figure: “Type B Spectrum Mask”. The mask type that is selected is displayed in the parameter area of the screen under the Mask Type and Antenna Power.
Masks For Channel Map of UHF (Brazil):
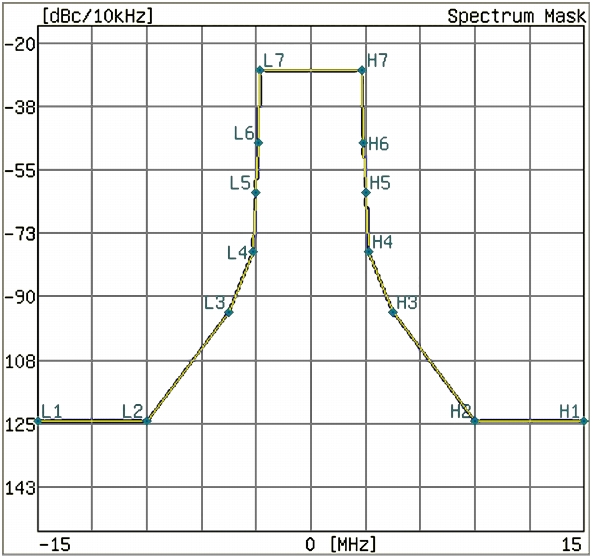
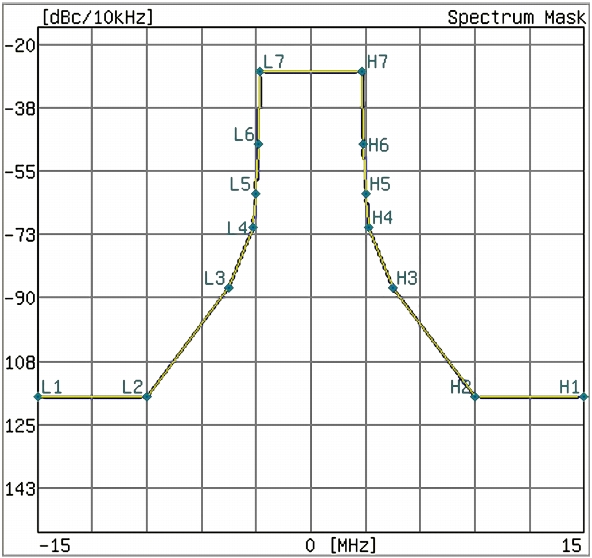
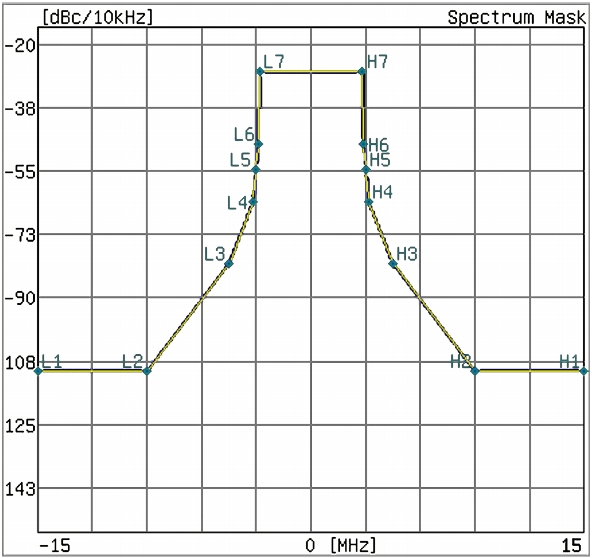
These three mask types are shown in Figure: “Critical Mask for UHF (Brazil) Channel Map”, Figure: “Subcritical Mask for UHF (Brazil) Channel Map”, and Figure: “Noncritical Mask for UHF (Brazil) Channel Map”.
Go next to Step 8 through Step 11 for UHF (Brazil) Channel Map, then skip to Step 13. For all others, go directly to Step 12.
The true color of the mask on the instrument display is blue on a black background. To enhance the mask for documentation purposes only, it was changed to yellow in Figure: “Critical Mask for UHF (Brazil) Channel Map”. In the printed manual, the screen has been changed for better contrast so that the mask line and the data line appear in black against the white background of the screen. Any similar display on your instrument may differ from this example.
 |
The true color of the mask on the instrument display is blue on a black background. To enhance the mask for documentation purposes only, it was changed to yellow in Figure: “Subcritical Mask for UHF (Brazil) Channel Map”. In the printed manual, the screen has been changed for better contrast so that the mask line and the data line appear in black against the white background of the screen. Any similar display on your instrument may differ from this example.
 |
The true color of the mask on the instrument display is blue on a black background. To enhance the mask for documentation purposes only, it was changed to yellow in Figure: “Noncritical Mask for UHF (Brazil) Channel Map”. In the printed manual, the screen has been changed for better contrast so that the mask line and the data line appear in black against the white background of the screen. Any similar display on your instrument may differ from this example.
 |
|
8.
|
Press the Filter Selection submenu key to open the Select Filter list box. Use the Default filter or select one of the three user‑specified filters. The default selection is for typical transmitter output filter characteristics. Refer to Table: “Default Filter Characteristics Normalized to – 27.4 dB” for the default filter parameters.
|
Other transmitter output filter characteristics can be created by using Master Software Tools. Refer to the Master Software Tools User Guide. You can save your own filter specifications with meaningful titles to replace those that are labeled User1, User2, and User3 in the Select Filter list box.
|
Offset (MHz)
|
Attenuation (dB)
|
|
– 15.00
|
|
|
– 9.00
|
|
|
– 4.50
|
|
|
– 3.15
|
|
|
– 3.00
|
|
|
– 2.86
|
|
|
– 2.79
|
|
|
9.
|
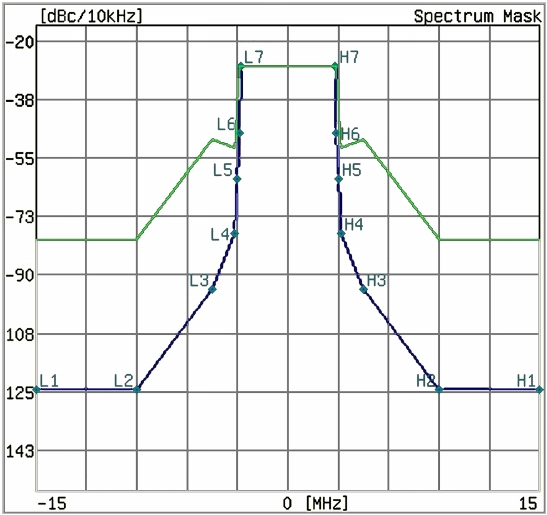
Press the Filter Data submenu key to turn this feature On or Off. When On, the filter characteristics (normalized to – 27.4 dB) are displayed in green. This green display is not part of the measurement.
|
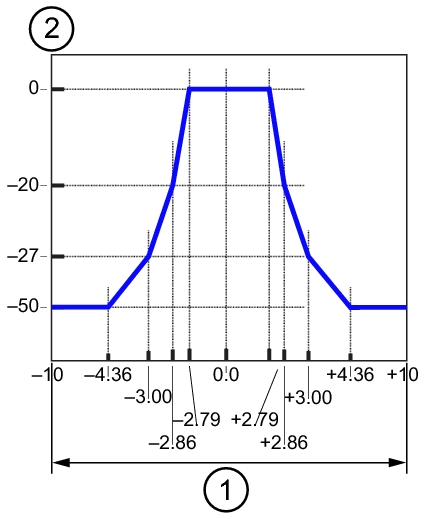
Figure: “Default Filter Data (Green Line) Normalized to – 27.4 dB” shows two measurement lines. The line through the points labeled L1 to L7 and H7 to H1 is displayed in blue in the graph on the instrument screen and represents the applicable mask. The line that begins at approximately – 80 dBc/10 kHz and passes through the points labeled L6, L7, H7, and H6 is displayed in green in the graph on the instrument screen and represents the filter characteristics. In the printed manual, the screen has been changed for better contrast so that the blue mask line and the green filter data line appear in black against the white background of the screen. The instrument displays a black background, which has been changed to white for documentation purposes. Any similar display on your instrument may differ from this example.
 |
|
10.
|
Press the Corrected Data submenu key to turn this feature On or Off. When On, the Corrected Data is displayed in yellow. This yellow measurement data is the measurement data after being corrected with the filter characteristics (the filter must first be applied).
|
|
11.
|
|
12.
|
If mask type is Type B (0.25W < P <= 2.50W) or Type B (0.025W < P < 0.25W), then set up the antenna power by pressing the Antenna Power submenu key, which is displayed only for these two mask types.
|
|
a.
|
Press the Antenna Power submenu key to open the Antenna Power Editor dialog box and to display the Units menu, which has two submenu keys: W and mW. The range and increments of change are displayed in the dialog box.
|
You may use the numeric keypad to set the power level, then press a Units submenu key for watts or milliwatts. Pressing the Enter key is the same as pressing the W submenu key.
You may also use the Up/Down arrow keys and the rotary knob to set the power level, and then press either the W submenu key or the Enter key. The Up/Down arrow keys change the power level in increments that are 10 times the incremental steps that are shown in the dialog box, and the rotary knob changes the power level in the displayed increments. The value that is displayed in the dialog box is within the indicated range, which is expressed in watts, so pressing the mW submenu key produces an “Out of range.” message.
|
b.
|
If mask type is Type B (0.25W < P <= 2.50W), then set the antenna power within the range 0.26 W to 2.50 W. If mask type is Type B (0.025W < P < 0.25W), then set the antenna power within the range 0.026 W to 0.249 W. When changing the antenna power, the out‑of‑band floor part of the mask standard line is changed as shown in Figure: “Type B Spectrum Mask”, items 1 and 2.
|
The masks (labeled 3, 4, and 5 in Figure: “Type B Spectrum Mask”) are shown in blue in the PDF file (black in the printed manual). The x‑axis is in MHz, and the y‑axis is in dBc/10 kHz.
 |
||
|
Modified range when using mask standard Type B (0.25 W < P <= 2.50 W)
|
||
|
Modified range when using mask standard Type B (0.025 W < P < 0.25 W)
|
||
|
Line when using mask standard Type B (P > 2.50 W)
|
||
|
Line when using mask standard Type B (P = 0.25 W)
|
||
|
Line when using mask standard Type B (P <= 0.025 W)
|
||
|
13.
|
Press the Floor Reduction submenu key to turn On or Off the floor reduction adjustment. Pressing this submenu key (to On or Off) triggers a measurement.
|
The Floor Reduction function lowers the influence of the floor noise (of the instrument) on the spectrum mask measurement, When Off, the spectrum analyzer measurement is displayed directly, as the signal spectrum (this is the normal measurement method). When On, the spectrum analyzer measurement is adjusted by subtracting the noise floor of the instrument from the signal spectrum.
|
14.
|
Press the Marker submenu key to turn On or Off the marker feature. A green diamond marker is displayed on the measured signal. The values that are displayed in the upper‑right corner of the graph are the relative frequency of the marker position (based on the graph center) and the relative level of the marker position (based on the 0 dB position of the graph).
|
|
15.
|
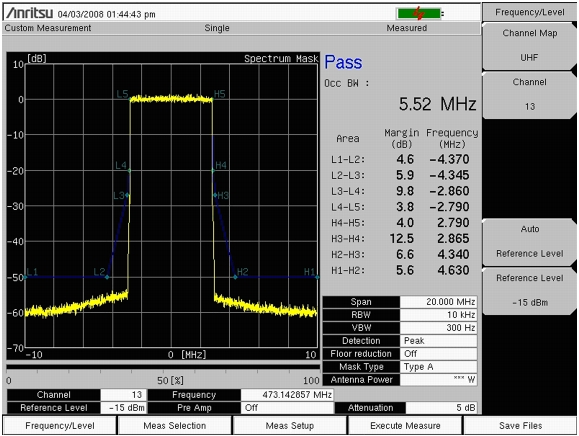
The measurement that is displayed in Figure: “Transmitter Spectrum Mask” may differ from any display on your instrument.
 |
|
16.
|
Save measurements to file by pressing the Save Files main menu key. Refer to the section, “Saving the Measurement Results” for more information regarding saving files.
|
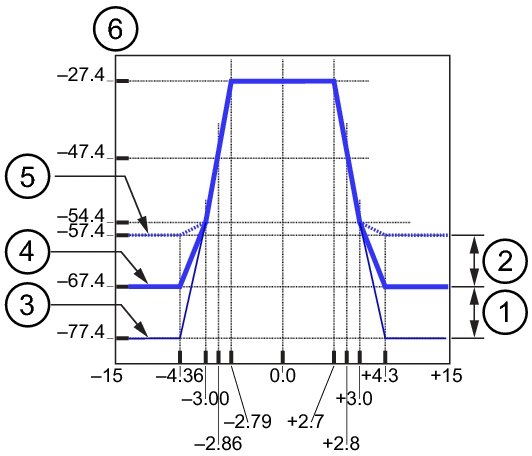
The Type A Spectrum Mask that is shown in Figure: “Type A Spectrum Mask” is displayed in blue in the PDF file (black in the printed manual). The x‑axis is in MHz, and the y‑axis is in dB.
 |
||