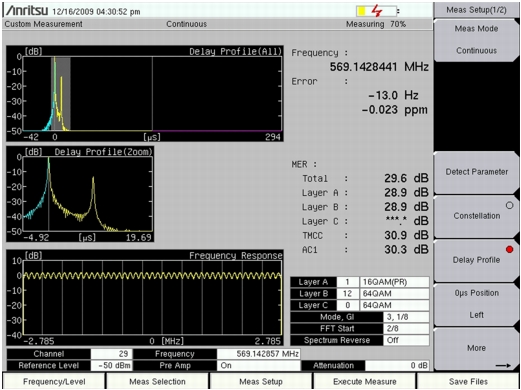
Delay Profile Information Display (Custom)
 |
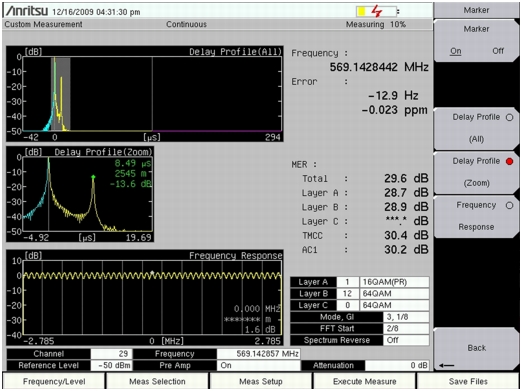
The Marker function is On, and the Marker menu shows that the Delay Profile (Zoom) graph is using the active marker.
 |
The Marker function is On, and the Marker menu shows that the Delay Profile (Zoom) graph is using the active marker.
 |
The blue range (visible in the Delay Profile (All) graph) shows signals that are delayed less than 0 µs if the largest signal (not necessarily the least delayed) is set at 0 µs. In both Delay Profile graphs, the yellow area shows delayed signals that are within the Guard Interval, and the magenta area shows signals that are delayed beyond the Guard Interval (which are potentially problematic). For more configuration details, refer to section “Delay Profile Configuration”.
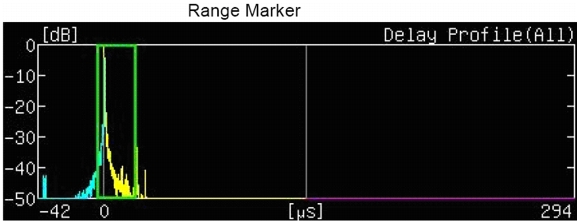
Delay Profile (All) Graph, Marker Enabled
 |
Delay Profile (Zoom) Graph, Marker Enabled
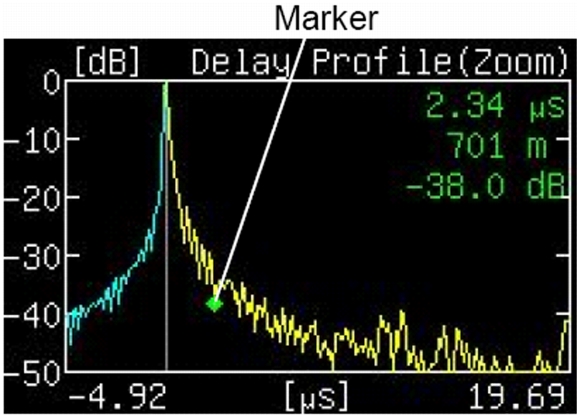 |
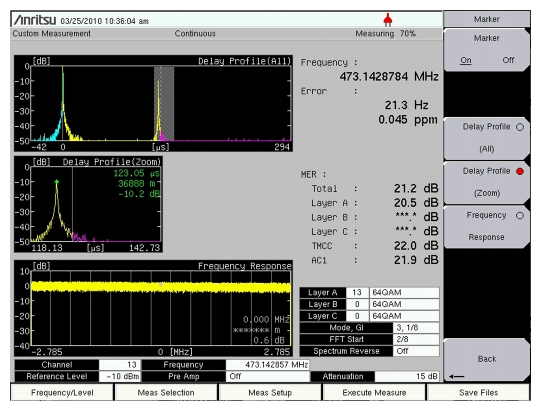
Distance = Delay Time × Velocity of Light (which is 2.99792 × 10⁸ m/s)
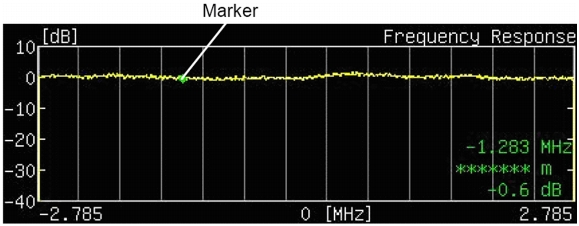
Delay Profile Frequency Response Graph, Marker Enabled
 |
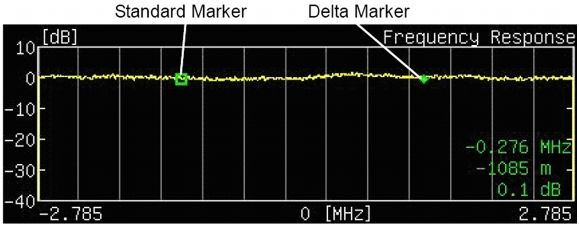
Delay Profile Frequency Response Graph, Delta Marker Enabled
 |