Meas Setup Menu - Spectrum Mask Measurement
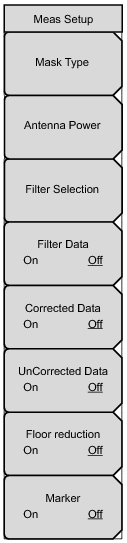 |
Mask Type
Press this submenu key to open the Select Mask Type list box. Choose from the 3 options: Critical Mask, Subcritical Mask, and Noncritical Mask. Refer to “Spectrum Mask, Custom”.
Antenna Power
Press this submenu key to open the Antenna Power Editor dialog box and to display the Units menu. Use the arrow keys, the rotary knob, or the numeric keyboard to set the power. Press the W or mW submenu key, or press the Enter key. Pressing Enter is the same as pressing the W submenu key. The power range and available increments are displayed.
This submenu key is displayed only when the selected Mask Type is Type B (0.25W < P <= 2.50W) or Type B (0.025W < P < 0.25W) (only when UHF (Brazil) is not the Channel Map). Refer to Step 12.
Filter Selection
Press this submenu key to display open the Select Filter list box. Use the Default filter or select one of the three user‑specified filters. Refer to Step 8. This submenu key is displayed only when the Channel Map is UHF (Brazil).
Filter Data
On Off Press this submenu key to toggle the setting On and Off. When On, the filter characteristics (normalized to – 27.4 dB) are displayed in green. This is not part of the measurement. Refer to Step 9. This submenu key is displayed only when the Channel Map is UHF (Brazil).
Corrected Data
On Off Press this submenu key to turn this feature On or Off. When On, the Corrected Data is displayed in yellow. This yellow measurement data is the measurement data after being corrected with the filter characteristics (the filter must first be applied). This submenu key is displayed only when the Channel Map is UHF (Brazil).
UnCorrected Data
On Off Press this submenu key to turn this feature On or Off. When On, the UnCorrected Data is displayed in gray. This represents the uncorrected measurement data before the filter correction has been applied. This submenu key is displayed only when the Channel Map is UHF (Brazil).
Floor reduction
On Off Press this submenu key to turn On or Off the floor reduction adjustment. Pressing this submenu key (to On or Off) triggers a measurement. Refer to Step 13.
Marker
On Off Press this submenu key to turn On or Off the marker feature. A green diamond marker is displayed on the measured signal. The values that are displayed in the upper‑right corner of the graph are the relative frequency of the marker position (based on the graph center) and the relative level of the marker position (based on the 0 dB position of the graph).
|
For additional information about Spectrum Mask measurements, refer to “Spectrum Mask, Custom”. Type A and Type B masks are described in “Spectrum Mask, Custom” and in Figure: “Type A Spectrum Mask” and Figure: “Type B Spectrum Mask”.
In the Easy Measurement mode, the Spectrum Mask Meas Setup menu has no available submenu keys. All measurement setup parameters are preset.