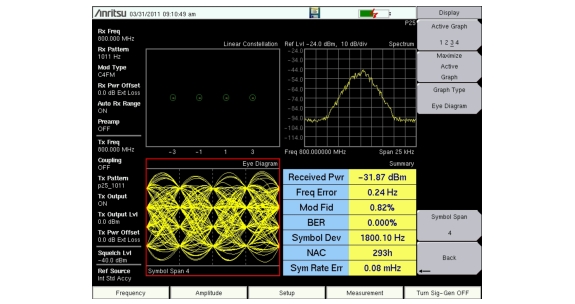
The preset view in NBFM Analyzer, P25/P25p2 Analyzer, NXDN Analyzer, dPMR Analyzer, DMR Analyzer, PTC Analyzer (ITCR and ACSES), and TETRA Analyzer measurements is the four-measurement view (
Figure: Four-Measurement View with the Eye Diagram as the Active Measurement). Tap once on an individual graph to make it active (red perimeter line).
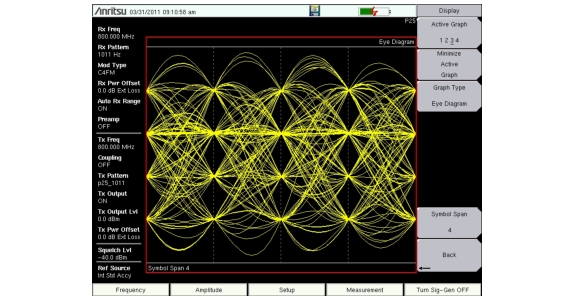
Tap twice on the active graph to display it in full screen view (
Figure: Eye Diagram as the Active Measurement in Full Screen View). Tap twice on the active graph again to return to four-measurement view.
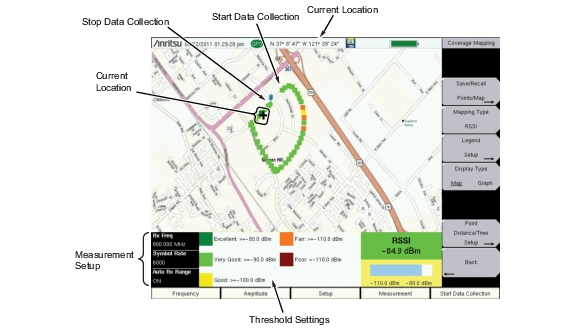
The default view in Coverage Mapping (
LMR Coverage Mapping) is the map view.
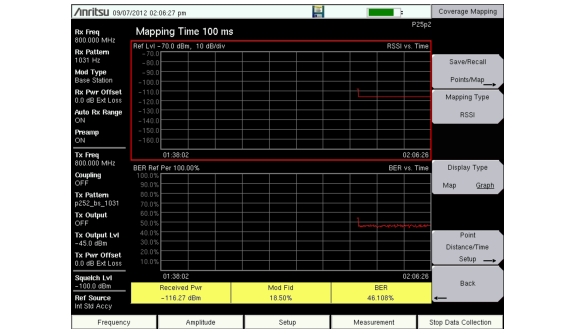
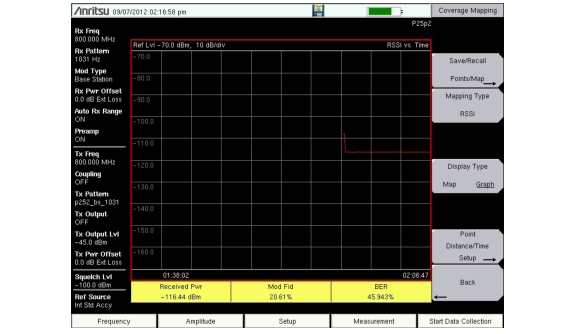
The two-measurement graph view (
Figure: Two-Measurement Mapping View with RSSI as the Active Measurement) is also available when mapping. Tap once on a graph to make it the active graph (red perimeter line).
Tap the active graph twice to display it in full screen view (
Figure: RSSI Mapping as the Active Measurement in Full Screen View). Tap the active graph twice again to return to the two measurement graph view.