The following NBFM Analyzer measurements are available on the LMR Master. From the Measurements main menu, press NBFM Analyzer twice. Press the Graph Type submenu key to select the measurement type.
Spectrum Graph
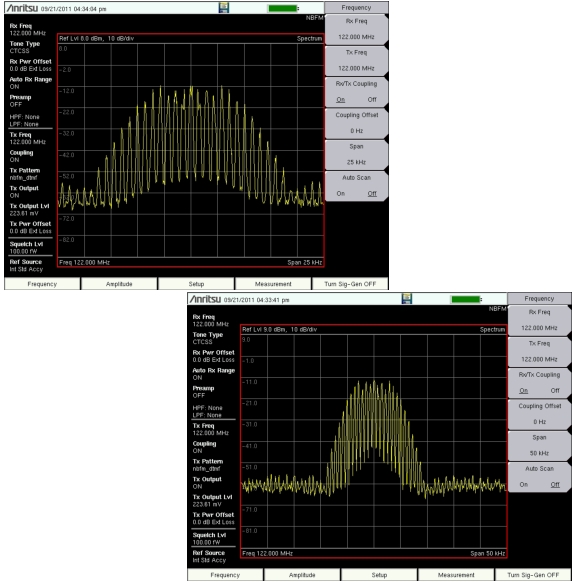
The spectrum view displays signal power (dBm) versus frequency. The frequency span is adjustable under the Frequency menu using the Span submenu. The reference level is adjusted with the Amplitude menu. Refer to Amplitude Menu for details. Figure: NBFM Spectrum Graph (25 kHz Span and 50 kHz Span) displays the same signal using a 25 kHz span and a 50 kHz span.
NBFM Spectrum Graph (25 kHz Span and 50 kHz Span)
Audio Spectrum Graph
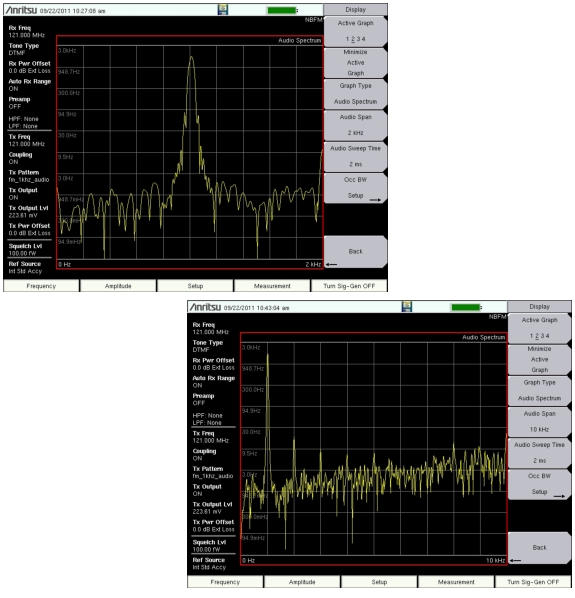
The Audio Spectrum graph displays the frequency deviation in the audio. The Audio Spectrum span is adjustable in fixed increments using the Audio Span button (Measurement> NBFM Analyzer). The reference level setting is the product of the intermediate frequency bandwidth and percentage (Setup> Filters). Figure: NBFM Audio Span (2 kHz and 10 kHz) displays the same signal using a 2 kHz span and a 10 kHz span. High Pass and Low Pass Filters are available for masking either the tone (low pass) or audio (high pass) in both the Audio Spectrum graph and Audio Waveform graph.
NBFM Audio Span (2 kHz and 10 kHz)
Audio Waveform Graph
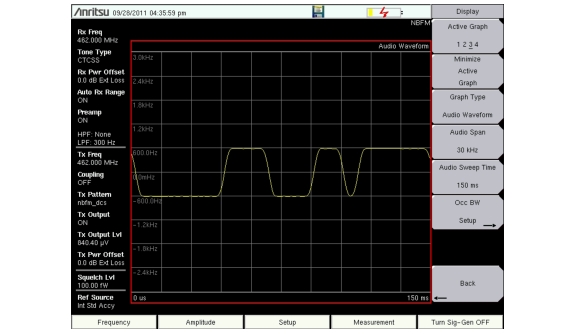
The Audio Waveform graph displays a zero‑span view of frequency deviation vs. time. The time span is adjustable from 50 μs to 150 ms using the Audio Sweep Time button (Measurement> NBFM Analyzer). The reference level setting is the product of the intermediate frequency bandwidth and percentage (Setup> Filters). Figure: NBFM Audio Waveform Example shows a DCS tone after applying a 300 Hz low pass filter. High Pass and Low Pass Filters are available for masking either the tone (low pass) or audio (high pass) in both the Audio Spectrum graph and Audio Waveform graph.
NBFM Audio Waveform Example
Summary Graph
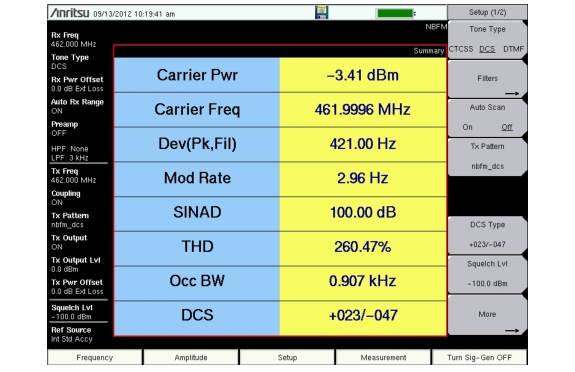
The summary graph provides an overview of an NBFM radio transmitter. The graph displays numeric values of carrier power, carrier frequency, freq error, frequency deviation, modulation rate, Signal to Noise and Distortion ratio (SINAD), Total Harmonic Distortion (THD), occupied bandwidth, and squelch/tone type of the input signal. Select the Tone Type (CTCSS, DCS, or DTMF) under the Setup menu.
Toggle between viewing carrier frequency or frequency error using the Measurements > NBFM Analyzer > Summary Freq Disp submenu key.
The Carrier Power value in the summary graph can be changed between dBm, watts, and volts using the Amplitude > Units > Rx Units submenu key. This setting also applies to the squelch level setting.
The Setup > Squelch Lvl submenu key sets the squelch power level. When the carrier power is lower than the set squelch level, all summary graph measurements except for Carrier Pwr are blanked out (‑‑). When the carrier power is above the squelch level, the measurements are displayed as shown in Figure: NBFM Summary Graph with Carrier Pwr Above the Squelch Level.
NBFM Summary Graph with Carrier Pwr Above the Squelch Level
Carrier Pwr in the Summary table is the integrated power of all the energy in the receiver bandwidth. Any peak amplitude reduction seen in the Spectrum display when compared to Carrier Pwr is a function of the instrument’s RBW setting. The reduction is specified as: 10*Log(Signal Bandwidth / Resolution Bandwidth).