In the Coverage Mapping menu, set the Display Type to Graph. Two graphs are displayed. Tap a graph to make it active (surrounded by a red bounding line).
Procedure to Monitor Base Station Synchronous Channel Decoding
1. Refer to the appropriate chapter for frequency, amplitude, and setup parameters.
2. Press the Measurement and then Coverage menu keys. You may need to press the Coverage menu key another time to display the Coverage Mapping menu.
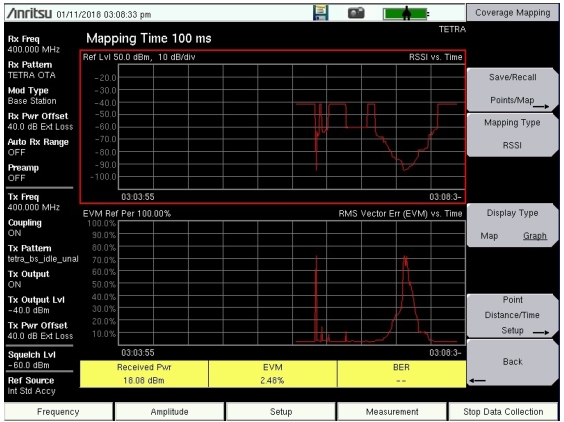
Display Type = Graph
3. If the Display Type is Map, then press the Display Type key again to toggle the setting to Graph. The display then shows two graphs. Figure: Display Type = Graph shows the GraphDisplay Type for TETRA analyzer. The two graphs may be any two types from the Mapping Type selection list. The figure shows EVM plotted versus time.
To change the plot in one of the graphs to a different mapping type:
a. Select the graph by tapping anywhere on the graph to activate it. The activated graph is shown within a red rectangle.
b. Press the Mapping Type submenu key and make a selection from the items displayed in the Mapping Type Selector list box: RSSI or RMS Vector Err (EVM).
4. To set up the sampling time for plotting the two selected graphs, set up the parameter called Repeat Time as follows:
a. In the Coverage Mapping menu, press the Point Distance/Time Setup submenu key.
b. In the Point Distance/Time menu, press the Repeat Time submenu key, and then enter a value by using the numeric keypad. A Time menu provides submenu keys for the units, from hour to µs. Anritsu recommends that this value be set to equal or exceed 3 seconds.
5. To start plotting the two graphs with respect to time, press the Start Data Collection main menu key. Note that if the previous plots need to be deleted, then press the Delete ALL Points submenu key, followed by the Enter key.
6. To stop the plotting of the two graphs, press the Stop Data Collection main menu key.
Note
Menu settings cannot be changed while data collection is in progress. You must stop the data collection before changing instrument settings. You can, however, change the active graph, and if needed, the selected graph can be made full screen by tapping the selected graph twice.
Saving Graph Data
Graph data is maintained during measurement as long as instrument memory has sufficient space to hold the data. Save data points from the graph after you press Stop Data Collection. The following key sequence displays the Save dialog box: