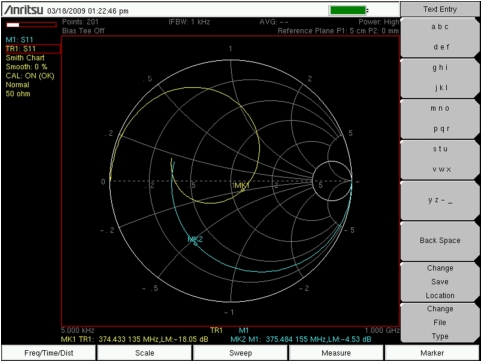
The Smith Chart is a useful tool for tuning input match. This complex impedance plot reveals which matching elements are necessary to match a device under test to the reference impedance (usually 50 ohms). Selecting “Smith Chart” as the graph type provides this tuning‑friendly graph.
In Figure: Smith Chart Tuning Example, the untuned blue trace is overlaid on the tuned yellow trace. The untuned response resembles a series capacitance and series resistance (starts as open circuit at low frequency, and approaches center of chart towards higher frequencies). This series capacitance is tuned out at 375 MHz by placing a shunt inductance in the circuit.
Smith Chart Tuning Example
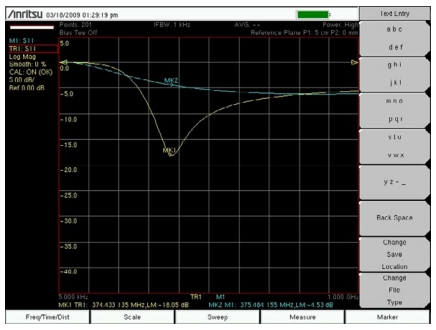
In Figure: Log Magnitude at 375 MHz, the more familiar log magnitude response is showing the input match improvement at 375 MHz. Trace 1 (shown in yellow with marker MK1) is the trace of the tuned circuit.
In the electronic (PDF) file of this user guide, the traces are shown in color, and are therefore easier to distinguish.
In the printed grayscale images, M1 drops smoothly from approximately 0 dB to approximately – 6 dB and utilizes marker MK2. Trace 1 (TR1) has nearly the same end points, but dips to – 18.05 dB, as shown at marker MK1.