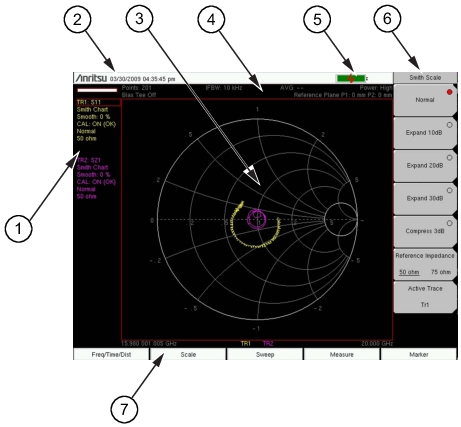
Figure: Vector Network Analyzer Smith Chart Display illustrates some of the key information areas of the vector network analyzer display screen on the VNA Master MS20xxC. The measurement and the display type that are illustrated here may not be the same as currently shown on your instrument. The purpose of the figure is to show the general areas of the display, which are labeled in the figure. Refer to the VNA Measurement Guide, Chapter 6, “VNA Menus” for more detailed soft key descriptions (refer to Supplemental Documentation for document part numbers).
Vector Network Analyzer Smith Chart Display
1
Instrument Settings Summary (unique to each trace)
2
Real Time Clock
3
Measurement Display Area (or Sweep Window)
4
Instrument Settings Summary (applies to all traces)
5
Battery Charge Indicator
6
Soft Key Labels (or Active Function Block)
7
Function Hard Key Labels
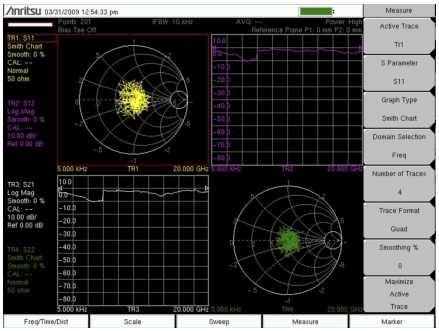
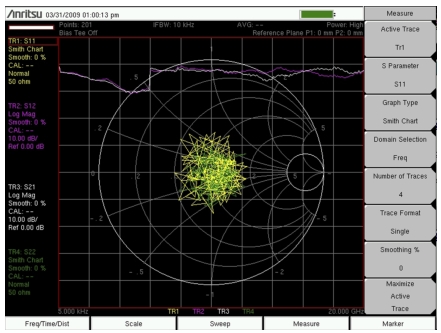
The MS20xxC features a versatile new display option for better measurement convenience. Because the VNA Master measures all four S-parameters simultaneously, with fully‑reversing test signals at both Port 1 and Port 2, the measurement display provides up to 4 simultaneous window images. As shown in Figure: 4 Traces in 4 Window Images (Quad Trace Format), each one of the S‑parameters could be displayed in its own quarter window. Additionally, the display could be divided into three, two, or one graph areas. An example of four S‑parameters overlaid onto one graph area is shown in Figure: 4 Traces in 1 Window Image (Single Trace Format).
4 Traces in 4 Window Images (Quad Trace Format)
4 Traces in 1 Window Image (Single Trace Format)
Instrument Settings Summary
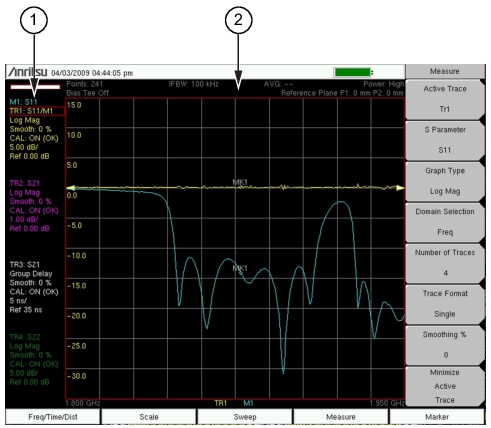
The instrument settings that apply to all traces are summarized in the top two rows of the measurement display screen (refer to item 2 in Figure: Instrument Settings Summary on Measurement Display Screen). The summary includes the Number of Points, the IF Bandwidth, the Averaging count, the Port Power level, and the Bias Tee status, all of which apply to both ports. The summary also includes the Reference Plane Extension values, which differ for each port.
Instrument Settings Summary on Measurement Display Screen
1
Instrument Settings Summary (unique to each trace)
2
Instrument Settings Summary (applies to all traces)
The instrument settings that are unique to each trace are summarized in an information block on the left side of the measurement display screen (refer to item 1 in Figure: Instrument Settings Summary on Measurement Display Screen). Each block contains the trace number followed by the S‑parameter that is assigned to that trace (TR4: S22, for example). If the trace has Trace Math applied to it, then the math function is also displayed on that line (TR1: S11/M1, for example), where M1 is the memory that is associated with TR1, and the math function is Trace / Memory). The S‑parameter that is assigned to the trace memory is shown (if enabled) at the top of each trace information block (M1: S11, for example). Each trace block also includes the Graph type, the smoothing percentage, the calibration status, and the scale (Resolution per Division and the Reference Value). The calibration status indicates whether the calibration is ON, OFF, or non‑existent (--) for the specific S‑parameter that is assigned to each trace. If the Calibration is ON, then its validity is also displayed (OK,?, or X).