Windowing is a frequency filter that is applied to the frequency‑domain data when it is converted to time‑domain data. This filtering rolls off the abrupt transition that occurs at the start and stop frequencies. This effectively produces a time‑domain response with lower sidelobes. Windowing allows a limited degree of control over the pulse shape, trading ringing (sidelobes) for pulse width. Four different windows are available: Rectangular, Nominal Sidelobe, Low Sidelobe, and Minimum Sidelobe. The Rectangular option provides the narrowest pulse width, and the Minimum Sidelobe option provides the least ringing (fewest sidelobes). For more details on Windowing, refer to Windowing.
Distance‑to‑Fault Measurement Example
The most common time domain and distance domain measurement that is made by using a handheld VNA is distance‑to‑fault (DTF). Using this measurement, you can find the location of faults (or discontinuities) along the length of a cable or waveguide. This measurement is typically performed as a reflection measurement (S11 or S22).
The VNA Master can be easily set to perform distance‑to‑fault measurements. Following are the key parameters that need to be set for these types of measurements:
In the Measure Menu:
• S‑parameter = set to S11 if the cable or waveguide is connected to Port 1 (or S22 for Port 2)
• Domain Selection = Distance
• Graph Type = Log Mag, SWR, or Real (depending on preference)
In the Sweep Menu:
• Number of Points (Data Points) = the larger the number, the longer the maximum distance (at the expense of a slower sweep speed)
In the Freq/Time/Dist Menu:
• Start Freq/Stop Freq = set to within the frequency range of the device under test (the wider the frequency range, the better the distance resolution, but the shorter the maximum distance)
• Start Dist/Stop Dist = set to view the specific length that you want to view
• Windowing = Rectangular is the default window (set to other windows if sidelobe levels are too high)
In the Additional Dist Setup Submenu:
(under Freq/Time/Dist Menu)
• DUT Line Type = set to Coax or Waveguide
• Cable List/Waveguide List = pick a cable or waveguide from a list to capture its propagation velocity and cable loss (if it is coax) or its cutoff frequency and waveguide loss (if it is waveguide). Alternatively, just enter these parameters directly if the specific cable or waveguide that you are testing is not in the list. Note that you can add coax entries into the list via the Master Software Tools program.
• Units = choose between m (meters) or ft (feet)
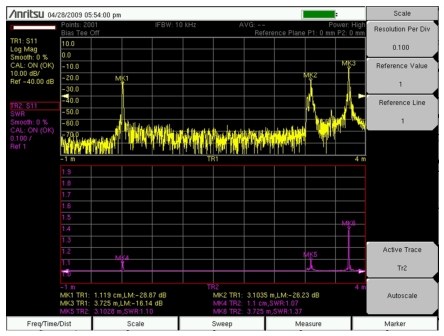
Figure: Distance Domain Measurements of 3.7 m Cable Showing S11 (Log Mag and SWR) shows a typical distance‑to‑fault measurement result. The device under test is a 3.7 m long cable with a discontinuity close to the end of the cable, at 3.1 m. The display shows the Log Mag (top) and SWR (bottom) responses. In both results, the ends of the cable and the discontinuity are all clearly identifiable.
Distance Domain Measurements of 3.7 m Cable Showing S11 (Log Mag and SWR)