Filters are 2-port devices that lend themselves well to a full 2-port measurement. They are usually compact devices with both sides of the component being easily accessible.
Setup Considerations
To perform the measurement, set the frequency to the range of interest, and set the power level to high. Perform a 2-port calibration by using the appropriate connector type. Also refer to section Calibration Considerations.
Measurement Readout and Interpretation
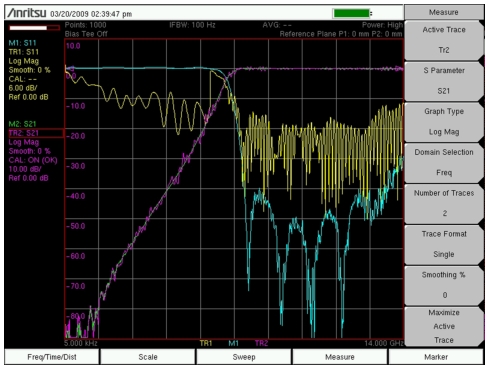
The screen‑captured measurement that is shown in Figure: High Pass Filter with 2‑Port Calibration is an overlay of S11 and S21 of a highpass filter. This measurement is comparing the transmission response calibration and the full 2-port calibration. The full 2-port calibration offers a dramatic improvement in return loss accuracy. The transmission response calibration is sufficient for a rough measurement of insertion loss.
High Pass Filter with 2‑Port Calibration
M1 and M2 are the full 12-term calibration responses. TR1 and TR2 are the responses from the transmission response calibration.
In the electronic (PDF) file of this user guide, the traces are shown in color, and are therefore easier to distinguish.
In the printed grayscale images, M1 and M2 are smoother than traces TR1 and TR2.
M1 and TR1 begin at the low end of the frequency range at approximately 0 dB and continue above – 20 dB until mid frequency range. Then TR1 ranges between approximately – 10 dB and – 50 dB, while M1 ranges to the bottom of the sweep window, mostly below – 30 dB.
M2 and TR2 begin at the low end of the frequency range below – 60 dB and sweep upward to approximately 0 dB at mid frequency range. They continue at approximately 0 dB to the high end of the frequency range.
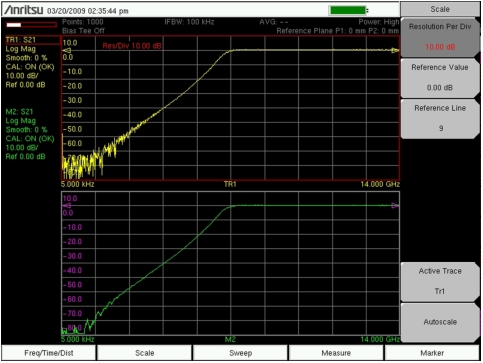
Highpass Filter with 2‑Port Calibration, 10 dB/div and 1 dB/div
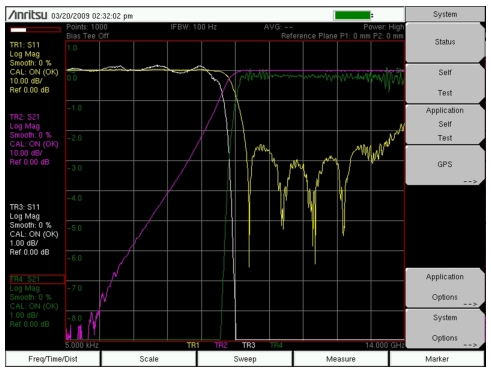
IF-bandwidth can be reduced to lower the noise floor of the instrument. The screen‑captured measurement that is shown in Figure: 100 kHz (bottom trace) and 100 Hz IFBW (top trace) uses trace memory to show the same measurement taken with a 100 kHz IFBW and with a 100 Hz IFBW measurement. Narrower IF bandwidths slow down the measurement speed, but provide a lower measurement noise floor.
100 kHz (bottom trace) and 100 Hz IFBW (top trace)