Press the Marker main menu key to display the Marker menu.
Note
Marker menu is not available in Swept PIM measurement mode. Refer to Marker 1.
Selecting, Activating, and Placing a Marker
Marker Selection Box
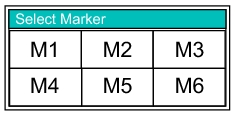
1. Press the Marker submenu key to display the Select Marker box, as shown in Figure: Marker Selection Box. Press the desired marker number. The selected marker number is displayed in the sweep window and is also underlined on the Marker submenu key.
2. Press the On Off submenu key so that On is underlined. The selected marker is displayed in red, ready to be moved.
3. Use an Arrow key or the touch screen to place the marker on the desired frequency.
4. Press the Marker To Peak submenu key to move the active marker to the highest signal amplitude that is currently displayed on screen. Press the Marker To Valley submenu key to move the active marker to the lowest signal amplitude that is currently displayed on screen.
5. Repeat Step 1 and Step 2 to activate and move multiple markers.
Selecting, Activating, and Placing a Delta Marker:
1. Press the Marker submenu key and then press the desired delta marker number in the Select Marker box.
2. Press the Delta On Off submenu key so that On is underlined. The selected marker is displayed in red, ready to be moved. The marker number that is displayed in the sweep window changes from M# to Δ# (for delta marker).
3. Use an Arrow key or the touch screen to place the delta marker on the desired offset frequency from the associated reference marker.
Example: Delta Marker 4 is associated with reference Marker 4 (same number).
4. Repeat Step 1 and Step 2 to activate and move multiple markers.
Viewing Marker Data in a Table Format
The marker table is available only in Distance‑to‑PIM measurements. In PIM vs. Time measurements and DTP measurements, the active marker number and the x‑axis and y‑axis values are displayed in green characters just above the measurement graph at the left side.
Press the Marker Table submenu key so that On is underlined. All marker and delta marker data are displayed (when On) in a table under the measurement graph. The table column heading are in white characters in the blue table heading.
Press the Marker Table submenu key so that Large is underlined. The values displayed are for the active marker, and the marker number is displayed in white characters in the blue table heading and also in green characters above the upper‑left corner of the measurement display grid. When you change the active marker, the table data is updated.