Note that Spectrum Analysis is treated like an application in the MS464XB (like Noise Figure and Pulse) so setups are not carried over from the other applications when entering. The application will preset to a single trace display (Power Out graph type with units of dBm, b2/1 as the response parameter) but previous spectrum analysis .chx files can be recalled. All applications are per-channel so one can configure other channels as Transmission/Reflection (regular S-parameter measurements), Noise Figure, etc.
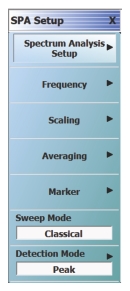
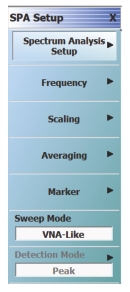
The basic menu upon entering the application is very simple and mainly consists of shortcuts to the most commonly used other menus for this application: frequency, scale, averaging and marker (see Figure: Main Spectrum Analysis Setup Menu). These menus have some changes from what sees in other applications (e.g., RBW is displayed instead of IFBW on the averaging menu, some processing choices are not available, etc.). The first button opens a configuration dialog that is discussed in detail below. The Sweep Mode button toggles between Classical (spectrum analyzer-like) and VNA-like. The difference between the two modes relates to the measurement point density and is also discussed below.
Main Spectrum Analysis Setup Menu
Classical Mode
VNA-Like Mode
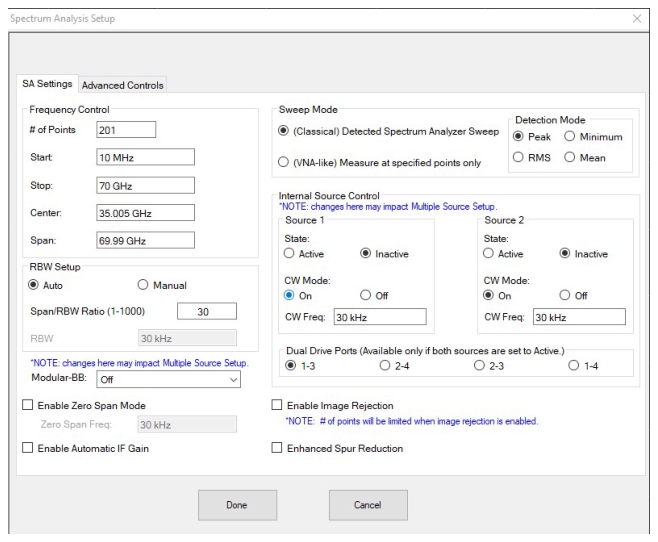
The setup for the spectrum analysis application is a bit different from that in the other VNA applications and the nomenclature has shifted in places to be closer to that of a classical spectrum analyzer, but the operational aspects are similar. The first tab of the configuration dialog (Spectrum Analysis Setup) is shown in Figure: First Tab Of the Spectrum Analysis Setup Dialog.
First Tab Of the Spectrum Analysis Setup Dialog
This happens to be for a four-port system, but the only addition relative to that for a two-port system is the ‘Dual Drive Ports’ section (that selection will also not be available for a single-source four-port system).
Sweep Mode: This selects how the instrument will actually sweep over the requested frequency range. With the ‘VNA-like’ mode, the instrument will measure only at the points in the frequency list (and segmented sweep is available). Thus, signals not precisely at those points (or within a RBW or so) will not be seen. This mode is fast and ideal when the frequencies of interest are known (or when the step size is on the order of a RBW, so that more of the complete spectrum can be captured). The ‘Classical’ mode is more like a traditional spectrum analyzer in that all frequencies in the range are scanned with adjacent RBW-sized chunks. Thus signals will not be missed, but it can be a much slower measurement. More total points are allowed than in TR and other applications since multiple sweeps are employed behind-the-scenes. There is a cap on the number of measurements in a sub-sweep (those measurement associated with a single display point) of 25000 or 100000 (and half that if image rejection is enabled). If the sub-sweep would require more measurements than that, the measurement count will be truncated. Note that sub-sweeps require more time for frequency table recalculation so the sweep rate is more irregular and a message will appear in the status bar to note the altered sweep behavior.
When in this ‘Classical’ sweep, the detection mode is relevant in that it determines how the measurements between display points will be reduced to a single value for that display point.
Peak: The measurement with the maximum linear magnitude of the measurements in the subrange of the given parameter will be displayed. This is the default selection.
Minimum: The measurement with the minimum linear magnitude of the measurements in the subrange of the given parameter will be displayed. This is useful for very dense signals in the sweep range of interest.
RMS: The root-mean-square value of the linear magnitudes of the given parameter will be used as the result for the subrange. This can be useful for noise-like signals.
Mean: The arithmetic mean of the linear magnitudes of the given parameter will be used as the result for the subrange. This can also be useful for noise-like or stochastic signals or those that are otherwise very dense.
To summarize the sweep modes:
VNA-like: Fast and measures only at the frequency points specified. All frequency-domain sweep types are permitted. For complete spectral coverage, the step size needs to be on the order of a RBW, but this is not always needed.
Classical: Measures over the entire range specified with actual measurements dictated by Span/RBW ratio. This is a slower measurement process but will not miss signal content. Only linear frequency sweep and log sweep types are available.
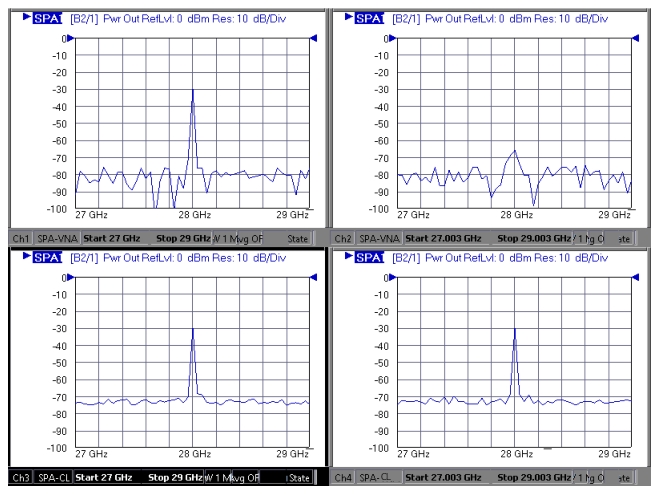
As an example, consider the four spectra shown in Figure: Spectrum Analysis Modes: VNA-like and Classical. In all cases, a signal at 28 GHz was applied to the VNA and a displayed set of 51 points were used with a step size of 2 MHz and the RBW was 1 MHz. Channels 1 and 2 are in the VNA-like point mode while channels 3 and 4 are in the classical mode with the peak detection selected. In channels 1 and 3, the center was set at 28 GHz so a display point corresponded to the input signal and the signal is clearly visible. The noise floor looks a bit different in the classical mode since the peak values in each subinterval are displayed. In channels 2 and 4, the center was set to 28.003 GHz so 28 GHz is not a display point frequency. One can then see the signal is distorted in the VNA-like mode (channel 2) since no measurements are made within more than an RBW of the input signal. In channel 4, the signal is still observable with the correct magnitude since the subinterval measurements capture the tone.
Spectrum Analysis Modes: VNA-like and Classical
Frequency Control: These entries mimic those on the main frequency menu and are placed in this composite dialog for convenience. The number of points represents the data points to be plotted (or saved, etc.) which, in the case of a Detected Spectrum Analyzer Sweep (see Figure: Spectrum Analysis Modes: VNA-like and Classical), is smaller than the number of measurement points.
RBW Setup: This is the analyzer IF bandwidth to be used in the measurement. If Auto is selected, the bandwidth will scale with the span using the entered ratio (the default value of this ratio is 100; if the span is very large at all, the RBW will max out to 1 MHz). If that computation results in a RBW < 1 Hz or > 1 MHz, the RBW will be limited to the endpoint values. If Manual is selected, the RBW is entered directly in the range of 1 Hz to 1 MHz. Note that, at this time, there is no direct equivalent of video bandwidth (VBW) but that behavior can be emulated to some degree with sweep-by-sweep averaging.
Internal Source Control: By default, the internal source(s) of the VNA is/are turned off when in the spectrum analysis application but it/they can be activated to serve as a stimulus. If generically activated (CW mode OFF), the source(s) will track the receiver much like a tracking generator would. The power level of the source(s) can be set on the usual Power menu. If CW mode is ON, the source will be parked at the indicated frequency for the entire measurement cycle. If a dual source four-port instrument is being used and both sources are activated, the dual-drive ports selection will be relevant and will dictate which ports are sourcing (this overrides any parameter-related driving port selection).
If a different frequency plan is desired for the internal source(s) or if external synthesizers are to be used, the multiple source control system can be used. See Multiple Source Control (Option 7) for more information.
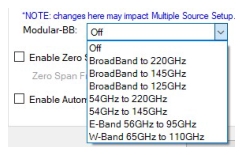
Modular BB: This enables selection of mm-wave banded and broadband operation (ME7838X systems) and will change the allowed sweep range limits accordingly. If variations on these modes are needed (or other, 3rd‑party mm-wave modules are in use), multiple source control can also be used. See Broadband/mmWave Measurements (Option 7, Option 8x) and Multiple Source Control (Option 7) of this guide for more information on both the broadband systems and the use of multiple source control. The basic selections on this pull down menu are shown below and include all of the ME7838 broadband systems as well as a number of the banded variants.
Modular BB Selection Pull-down
Different broadband and banded mm-wave system choices can be enabled here, which will set the receiver (and sources if used) appropriately.
When in these modular BB modes, the receiver will be programmed according to the plan for the module selected (including the use of the VNA receivers below a nominal 30 GHz for the broadband modules). If the source(s) is/are active, it/they will also use the frequency plan for the module selected. If a more complex relationship is desired, then multiple source control must again be used.
Note that factory receiver calibrations are not available for the modular BB configurations so performing a user receiver calibration is normally recommended.
Enable Zero-span Mode: This is the equivalent of VNA CW mode where the receiver is parked at a specific frequency but multiple measurements are displayed at that frequency (the x-axis labels can be in units of time; this can be changed to just a measurement count index under the Display menu). Note that unlike in the Transmission/Reflection and other applications, the zero-span frequency will be enforced (at the expense of start/stop on the frequency menu) and will not be coerced to the nearest frequency in the existing start/stop list.
Enable Automatic IF Gain: The automatic IF gain system changes gain levels based on the received IF signal so it may be undesirable for spectrally-broad or complex signals (can lead to the IF gain being set too high and compressing) so this is defaulted to OFF in the spectrum analysis application. If measuring a spectrally tight signal in-band or if measuring noise-like signals or if using the VNA source as a tracking source, this gain function can be activated which will improve the noise floor.
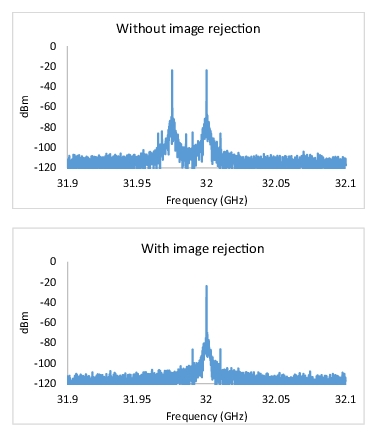
Enable Image Rejection: While the front-end of a VNA receiver is simple, a level of image rejection can be achieved by scanning both upper and lower response locations which is what this checkbox enables. This function does lengthen sweep time but can reject the image response by over 80 dB for simple signals. It is not as appropriate for non-stationary or signals with bandwidths of more than about 50 MHz. When in VNA-like mode, selection of this function reduces the maximum point count to 12500 (50000 if 100K mode is active). In classical mode, it doubles the number of sub-sweeps and increases sweep time.
The effect of image rejection is shown here for a simple single-tone input. Image rejection does slow down sweep speed and places some constraints on point count.
Because of the additional measurements required for image rejection, the maximum measurement point count is limited to 12500 or 50000 instead of 25000 or 100000 for the VNA-like mode. The display point limit for any given configuration of the classical detected operating mode will similarly be reduced by a factor of two. For the same reason, image rejection will also slow the sweep time.
Enable Spur Reduction: When enabled, spur reduction will use a more elaborate system of checks to reduce (particularly) self-conversion spurs from the LO and spurs generated between the source(s) and LO when the former is/are active. There will be no significant improvement in spurs created by external signals interacting with the receiver. Enabling this function does increase the frequency table computation time so it will take a bit longer for the sweep to start after a change is made to the frequency list. There is no impact to per-point measurement time after the sweeps start.
Note also that the front-end of the VNA is not preselected, so harmonic responses of the converters will appear on-screen. As an example, suppose the user has input a 7 GHz input so the internal LO will be at (7GHz +IF). If the receiver is sweeping at higher frequencies where the same physical LO is used (e.g., displayed frequency of 21 GHz + 2 IF) then another receiver response will appear. This is another case where the VNA-like sweep mode can be useful in identifying true harmonics.
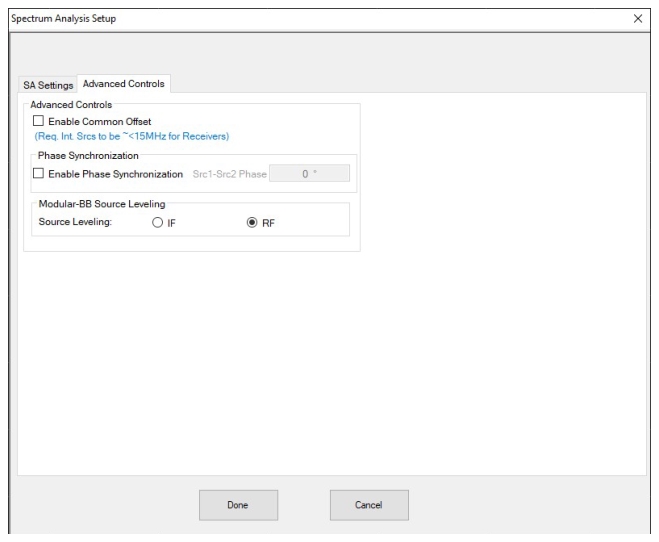
The second, and more advanced, tab of the Spectrum Analysis Setup Dialog
Enable Common Offset: This is a control that alters the detailed programming instructions sent to the internal sources and LO. When enabled, it can reduce net IF noise levels, but can only work when the source(s) and LO are close in frequency (~<15 MHz separation before multiplication); that is, close to a tracking application.
The main benefits accrue when working at higher mm-wave frequencies using external modules. If the internal source(s) and LO are not close in frequency, lock errors may be observed and there may be sweep disruptions.
Phase Synchronization: This only applies in dual source systems when both sources are active. This selection changes the synthesis configuration so the sources will have a controlled and repeatable phase relationship. This may be useful when the sources are being used to stimulate an active differential device (see Dual Source and DifferentialView™ (Option 31 and Option 43) for general information on the topic of true mode drive). Another application may be to compare phase relationships in cross-polarization or leakage experiments (note that phase measurements are possible in the spectrum analysis application but generally the sources will be put in a tracking relationship to the receiver). The phase relationship is driven by a factory phase calibration at the test ports (see Dual Source and DifferentialView™ (Option 31 and Option 43) for more details).
Modular BB Source Leveling: If a modular BB mode was selected on the previous screen (and a source is made active), this control defines how power control leveling is performed at mm-wave frequencies (generally above 54 GHz). IF leveling requires the source be tracking the receiver (otherwise it will go unleveled and rail to high power). RF leveling can be used in general but has less control range than IF. The Power menu is used to enter the requested source power and user power calibrations are available.