• MAIN | System | SYSTEM | Diagnostics | DIAGNOSTICS | Self-Test | SELF TEST Dialog Box
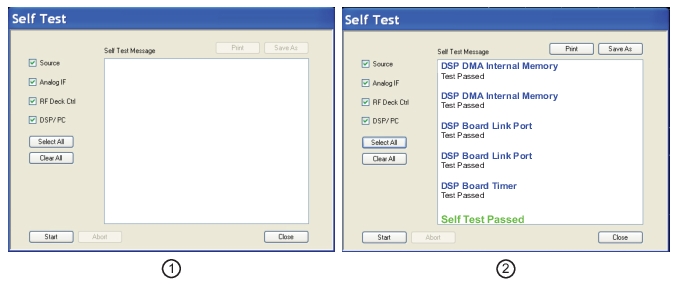
SELF TEST Dialog Box
1. SELF TEST Dialog Box – Test Not Started at left.
2. SELF TEST Dialog Box – Test Passed at right.
Instructions
1. Select any combination of tests from the available check boxes:
• Source
• Analog IF
• RF Deck Ctrl
• DSP/PV
2. The Select All button selects all tests. The Clear All button de-selects all tests.
3. Once selections are made, click Start to run the tests. Click Abort to cancel in-process tests.
4. Test results are displayed in the Self Test Message area.
5. A normal message is Self Test Passed.
6. Click Print to print to the local printer through an open Print dialog box. Click Save As to save as a Self Test Result TXT file typically located in C:\AnritsuVNA\Data. Click Close to close the dialog box.
• MAIN | System | SYSTEM | Rear Panel Output | REAR PANEL OUT.
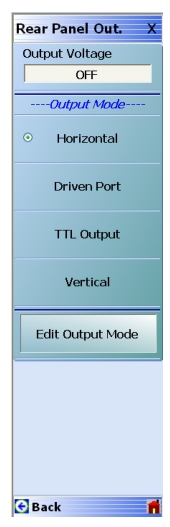
REAR PANEL OUT. (REAR PANEL OUTPUT) Menu
Output Voltage
Select toggles rear panel output voltage off and on.
Output Mode Button Selection Group
The Horizontal, Driven Port, and TTL Output buttons form a three (3) button selection group where the selection of any one button de-selects the other two buttons.
Horizontal Output Mode
The horizontal output mode sets the condition of the sweep independent of the port sweep voltage that corresponds to the start and stop sweep limits. The values are edited in the dialog box available from the Edit Output Mode button below.
Selecting the Horizontal button de-selects Driven Port and TTL Port.
Driven Port Output Mode
The driven port output mode assigns the voltage setting to whichever port is set as the driven port. The values are edited in the dialog box available from the Edit Output Mode button below.
Selecting the Driven Port button de-selects Horizontal and TTL Port.
TTL Output Mode
The TTL (Transistor-Transistor-Logic) button sets the voltage output to either pulse or level TTL. The values are edited in the dialog box available from the Edit Output Mode button below.
Selecting the TTL Output Mode button de-selects Horizontal and Driven Port Output.
Vertical Output Mode
Vertical Output Mode adds functionality to the rear panel analog out port so that it can represent the vertical magnitude of a trace in a scaled fashion. Users can employ this signal to drive external mechanical controllers and data recorders as part of a much larger measurement system.
Selecting the Vertical button adds output voltage to the analog out port that represents the vertical amplitude of a trace.
The Vertical Mode selection can be remotely programmed through the GPIB interface.
Edit Output Mode
Select displays the Edit Rear Panel Output Mode dialog box.
• MAIN | System | SYSTEM | Rear Panel Output | REAR PANEL OUT. | Edit Output Mode | EDIT REAR PANEL OUTPUT MODE Dialog Box
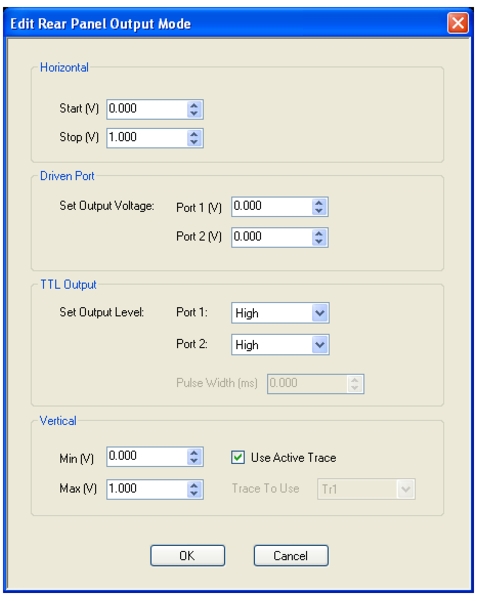
EDIT REAR PANEL OUTPUT MODE Dialog Box
Instructions
Use the dialog box for settings of horizontal voltage, driven port voltage, TTL output voltage levels, and Vertical voltage.
Horizontal Voltage
• Start (V). Selectable range from –10.000 to 0.000 to +10.000 V.
• Stop (V). Selectable range from –10.000 to 0.000 to +10.000 V.
Driven Port
• Set Output Voltage
• Port 1 (V). Selectable range from –10.000 to 0.000 to +10.000 V.
• Port 2 (V). Selectable range from –10.000 to 0.000 to +10.000 V.
TTL Output
• Set Output Level
• Port 1. Selectable options of High, Low, High Pulse, or Low Pulse.
• Port 2. Selectable options of High, Low, High Pulse, or Low Pulse.
• If High or Low Pulse selected, Pulse Width (ms) becomes available.
Vertical Voltage
• Min (V). Selectable range from –10.000 to 0.000 to +10.000 V.
• Max (V). Selectable range from –10.000 to 0.000 to +10.000 V.
Vertical has text boxes for entry of Vertical Mode Min (V), Vertical Mode Max (V), a check box for Use Active Trace, and a dropdown box to select which trace to use (Tr1 through Tr16)
The defaults for these fields are 0.000, 1.000, Checked (True), and Tr1 respectively.
These can be remotely programmed through the GPIB interface.