In many applications, having a simple list of frequencies where the step size between points is uniform is not adequate. The DUT specifications may have specifications in certain bands and certain specific frequencies that must be tested, there may be certain communications bands that must be tested, or there may be certain spot frequencies that are of interest for troubleshooting or analysis.
For these cases and others, segmented sweep allows one to put together a very arbitrary list of frequencies to sweep as well as having some control of instrument behavior that is distinct at these different points and/or segments. The entire sweep is broken into segments (a segment may contain one or many points) and in each segment, one can independently control:
• IF bandwidth
• Averaging
• Port 1 Power and Port 2 Power (although the step attenuators, if installed, must be in the same position for all segments to prevent premature wear)
There is a distinction made between frequency-based and index-based segmented sweep that should be explained:
• Frequency-Based
Frequency is always monotonically increasing (within a segment and between segments). Plotting may be based on the frequency or the index of the particular point (more on this later).
• Index-Based
The segments do not have to be in any order with regards to frequency. Plotting is always based on the point index.
Frequency-based is most commonly used and will be discussed in this section. Index-based sweeps, which is used when reverse sweeps and particular frequency order is important, is covered in the next section.
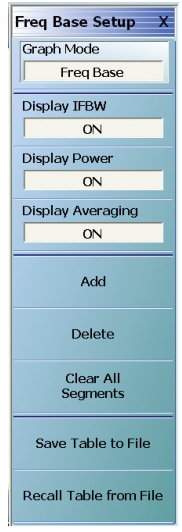
The main menu and an example entry table are shown in Figure: FREQ BASE SETUP (FREQUENCY-BASED SETUP) Menu and Figure: Tableau Entry Table for Frequency-based Segmented Sweep. The main purpose of this menu is to aid entering data into the table and to help save and recall that data. Note that segmented sweep tables can be saved/recalled separately from this menu or they can be saved/recalled as part of the global setup using the entries under the File menu.
FREQ BASE SETUP (FREQUENCY-BASED SETUP) Menu
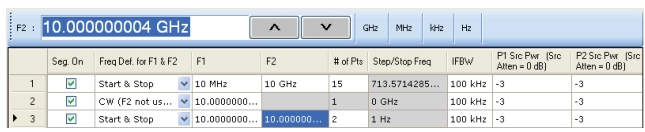
Tableau Entry Table for Frequency-based Segmented Sweep
The table will start with one segment and the start, stop and number of points must be defined. The pull-down item in Column 3 allows an alternatively specified start and step or a CW frequency. The step or stop frequency (which depends on the pull-down selection) will appear as a read-only field in Column 7. The IFBW, power and averaging columns can be enabled on the setup menu and entered separately by segment. The current source attenuator setting will appear in the column header and may not be changed by segment (will read 0 dB if the attenuators are not installed). If the display of these fields is not enabled, the values for those variables set in regular frequency sweep mode will prevail for all segments.
The Add, Delete, and Clear All functions are obvious. The delete function applies to the current row as indicated by the caret in column 1.
As with the multiple source tables, there are two ways to enter numbers
• Click on the cell and the text entry box above the table becomes active.
• Click twice on the cell and type directly into the cell. Frequency units must be entered and must have a space between the number and the units.
If an invalid number is entered in any field, the system will change the value to the nearest valid entry.
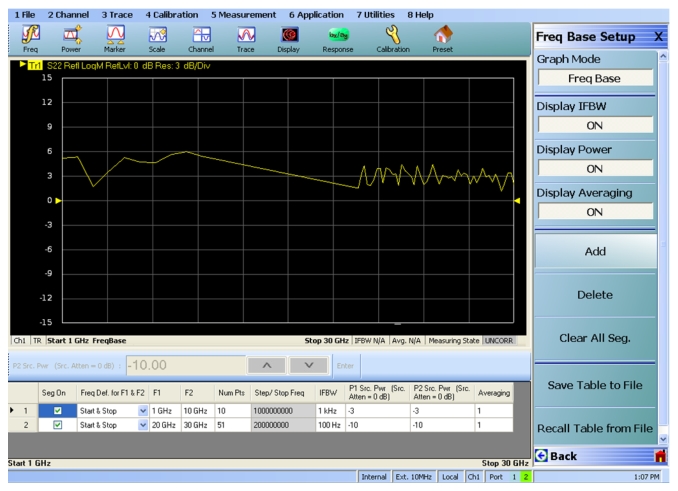
The one remaining item on the setup menu for frequency-based segmented sweep is graph mode, which controls how the x-axis is setup for all plotting activities but does not affect the sweep itself. In Frequency-based graph mode, the x-axis will be in frequency and all segments will be plotted where those frequencies lie. While correct, this can lead to an odd-looking display if the segments are disjointed as shown in Figure: Frequency-Based Graph Mode.
Frequency-Based Graph Mode
Since Segment 1 covers 1–10 GHz and Segment 2 covers 20–30 GHz, there is a gap in frequency where no measurements are made. For the purposes of plotting in this graph mode, the two areas are connected by a single line segment. Note that the point spacing in the plot precisely matches the frequency spacing.
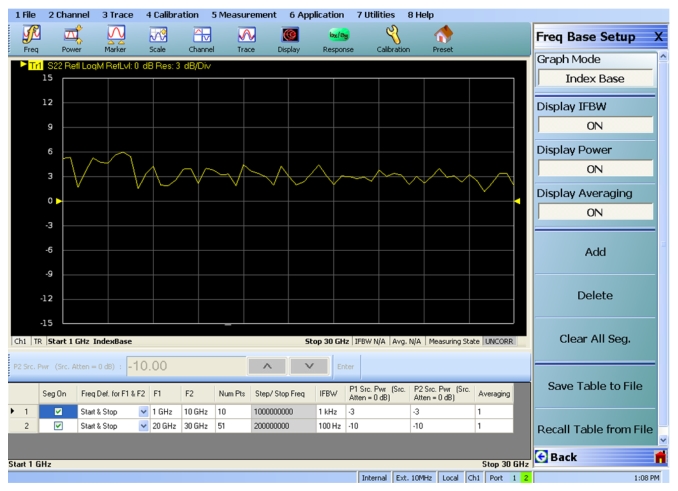
When all of the data points plotted without regard to proportional frequency separation are required. For these occasions, the Index-based graph mode is available and an example is in Figure: Index-Base Graph Mode for the same setup as Figure: Frequency-Based Graph Mode. Here, the x-axis is point index so all plotted points are equally spaced in the x-direction and the frequency based segmented sweep is disjointed.
Index-Base Graph Mode
It is important to keep separate the concepts of frequency- vs. index-based for the graph mode (which only controls how things are plotted) and frequency- vs. index-based segmented sweep type (which determines how the points are swept by the instrument hardware).