Scanner, Tx Test, Mapping, and Carrier Aggregation are measurements taken over the air. EMF measurements are available only with Option 444.
Antenna Status
The Antenna Status indicators, if any, are located in the bottom left corner of the instrument display. They show the number of antennas detected and which one is currently being measured. In OTA measurements, the Antenna Status is displayed when Show Mod Results is On for Scanner and Tx Test.
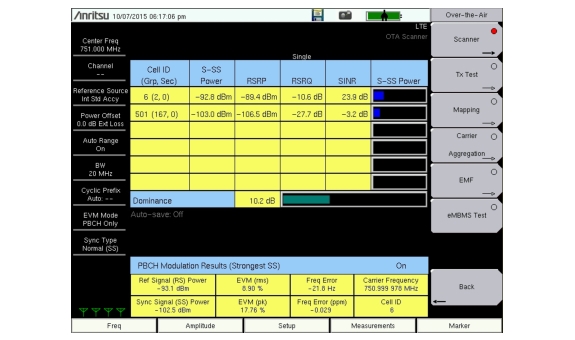
Scanner
The Scanner measurement scans for the presence of up to 6 cell IDs and the following measurement values.
Cell ID, Sector ID, Group ID
Identifying information sent by the transmitter in the sync signal.
S‑SS Power
Secondary Sync Signal power is displayed in dBm or Watts. The secondary sync signal is used to obtain frame synchronization and cell identity. S‑SS Power contains information needed for cell search.
RSRP
Reference Signal Received Power is the average power of Resource Elements (RE) that carry cell-specific Reference Signals (RS) over the entire bandwidth.
RSRQ
Reference Signal Received Quality provides additional information when RSRP is not sufficient to make a reliable handover or cell reselection decision. RSRQ is the ratio between RSRP and RSSI measured in dB.
SINR
Signal‑to‑Interference-plus-Noise Ratio is measured in dB.
Dominance
Dominance is the ratio of the power for the largest signal to the sum of all other signals found, measured in dB.
PBCH Modulation Results
The PBCH Modulation Results table is displayed when the Show Mod Results setting is set to On. Refer to OTA Scanner Menu. The displayed values are the same as described under Constellation.
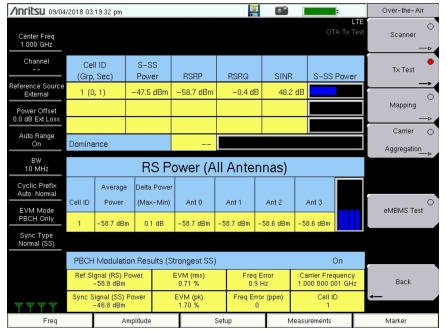
Tx Test
Tx Test measurements are optimized for remote radio heads and MIMO systems. The first table in Tx Test replicates the Scanner table measurements, except the measurement scans the presence of up to 3 cell IDs. The second table shows the RS power across all detected antennas (transmitters) for the strongest Cell ID. This is displayed as average power and delta power for the detected transmitters, along with a small bar graph that shows the relative RS powers for each Tx. The PBCH Modulation Results table can also be turned on.
Mapping (Coverage Mapping)
Coverage Mapping allows users to measure and map Sync Signal Power, Reference Signal Received Power (RSRP), Reference Signal Receive Quality (RSRQ) and SINR. It is the same measurement as in Scanner which scans for the presence of up to 6 cell IDs but only displays the presence of up to 3 cell IDs. For full details regarding Coverage Mapping setup and testing, refer to LTE and TD‑LTE Coverage Mapping.
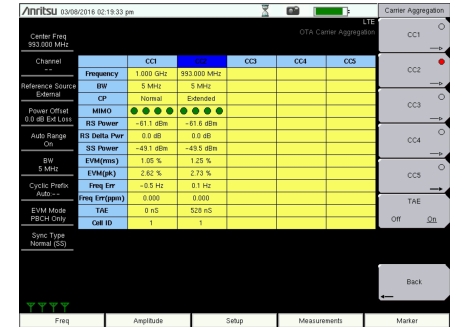
Carrier Aggregation
This measurement displays a table of up to five Component Carriers (CC) used in Carrier Aggregation and their measured signal components.
Frequency
This is the set center frequency.
Bandwidth (BW)
This is the set bandwidth of the Component Carrier.
Cyclic Prefix (CP)
The length of Cyclic Prefix can be specified as either Normal or Extended.
MIMO
Multiple input, multiple output technology, or spatial multiplexing, uses two or more simultaneous RF transmission paths to improve signal performance. In 2x2 MIMO, for example, the overall bitrate increases through transmission of different data streams from two TX antennas to two RX antennas on the same frequency and time, but different reference signals. Your Anritsu test instrument supports 2x2 and 4x4 MIMO configurations. Note that 4x4 MIMO may not be available if your instrument is loaded with older firmware. Refer to your instrument User Guide for instructions on updating firmware.
The MIMO status indicators on the instrument screen show which transmitters are active. See Figure: Over‑the‑Air Carrier Aggregation Measurement. There are two icons in a 2x2 MIMO configuration, four icons if 4x4 MIMO signals are detected. Active transmitters display as green dots. Inactive transmitters are gray. They correspond to the antenna icons displayed at the bottom left of the screen for each Component Carrier scanned.
Reference Signal (RS) Power
Reference Signal power is displayed in dBm or Watts. The reference signal is used for downlink channel estimation.
RS Delta Power
RS Delta Power shows the maximum relative power difference in dB between the RS powers of the MIMO signals and can be used to check correct MIMO configuration.
Sync Signal (SS) Power
Sync signal power is displayed in dBm or Watts.
EVM (rms)
The RMS (%) of all the error vectors, between the reconstructed ideal signals and the received signals, divided by the RMS value of the ideal signals.
EVM (pk)
The peak (%) of all the error vectors, between the reconstructed ideal signals and the received signals, divided by the RMS value of the ideal signals.
Freq Error
This is the difference between the measured carrier frequency and the specified carrier frequency. This number is only as accurate as the frequency reference that is used, and is typically only useful with a good external frequency reference or GPS.
Freq Error (ppm)
This is the frequency error displayed in parts per million.
TAE
Time Alignment Error (TAE) is a measurement of the differential transmission delay between the Component Carriers. The 3GPP specification identifies the limits of the delays for the system to operate properly.
Cell ID
Cell identifying information sent by the transmitter in the sync signal.
Measurement Setup
Scanner
1. Press the Measurements main menu key.
2. Press the Over‑the‑Air submenu key.
3. Press the Scanner submenu key to activate the OTA Scanner display. See Figure: Over‑the‑Air Scanner Measurements. Press the Scanner key again to display the OTA Scanner menu.
a. Press the Sort By... submenu key to list the Sort By menu and select the parameter the OTA Scanner will use for sorting (Cell ID, Group ID, Sector ID, S‑SS Power, RSRP, RSRQ or SINR) and press Enter.
b. Press the Show Mod Results submenu key to display or hide the Modulation Results of the strongest signal.
Note
When Show Mod Results is on, the scanner measurement speed is slower due to the additional time required to demodulate the strongest signal. Some instruments require the LTE demod option to toggle this submenu to On.
c. Use the Auto Save submenu key to automatically save measurement records. The instrument logs a data record at the end of each measurement cycle. A maximum of 10,000 records can be stored in a file.
4. Press Back to return to the Over‑the‑Air menu.
Over‑the‑Air Scanner Measurements
Tx Test
1. Press the Measurements main menu key.
2. Press the Over‑the‑Air submenu key.
3. Press the Tx Test submenu key to activate the OTA Tx Test display. See Figure: Over‑the‑Air Tx Test Measurement. Press the Tx Test key again to display the OTA Tx Test menu.
4. Press the Show Mod Results key to display or hide the PBCH Modulation Results (Strongest SS) table.
5. Press Back to return to the Over‑the‑Air menu.
Note
When Show Mod Results is on, the Tx Test measurement speed is slower due to the additional time required to demodulate the strongest signal. Some instruments require the LTE demod option to toggle this submenu to On.
Your Anritsu test instrument supports single-input single-output (SISO) as well as 2x2 and 4x4 multiple-input multiple-output (MIMO) systems. If a single antenna is active, the Component Carrier measurements illustrated in Figure: Over‑the‑Air Carrier Aggregation Measurement are aggregated from the entire modulated contents of the LTE signal. When two or more antennas are active, the measurement results displayed represent the QPSK modulated signal on the Physical Broadcast Channel (PBCH).
1. Press the Measurements main menu key.
2. Press the Over‑the‑Air submenu key.
3. Press the Carrier Aggregation submenu key to display the OTA Carrier Aggregation table. Press the key again to display the Carrier Aggregation menu. See Figure: Over‑the‑Air Carrier Aggregation Measurement.
4. Press one of the five Component Carrier (CC) submenu keys to set it up for measurement.