The following parameters are measured in the RF Measurement mode.
Channel Spectrum
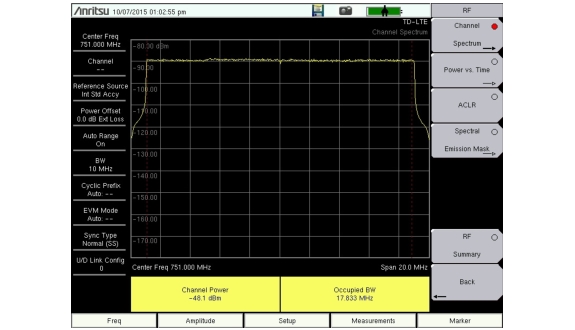
Channel Spectrum displays the spectrum of the input signal across one channel. The Channel Power and Occupied BW are computed and displayed below the graph.
Channel Power
Channel power measures the average power within the selected bandwidth and is expressed in dBm or Watts.
Occupied BW
The measured occupied bandwidth is calculated as the bandwidth containing 99% of the total integrated power within the selected span around the selected center frequency.
Power vs. Time
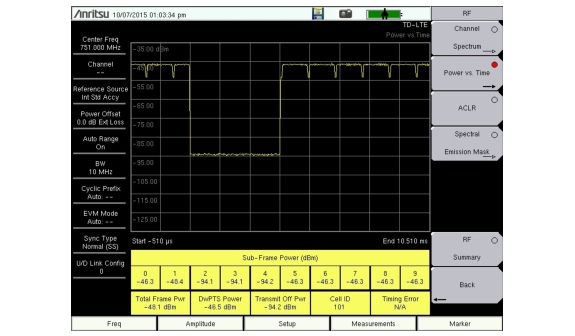
Power vs Time displays the power of the received signal in the time domain. A submenu allows the user to toggle between viewing 1 full Frame and 1 Sub‑Frame and specify a Sub‑Frame number when viewing just the Sub‑Frame.
Sub‑Frame Power
Power of each sub‑frame in dBm or Watts.
Total Frame Power
Average power of the 10 sub‑frames in dBm or Watts.
DwPTS Power
The power of the Downlink Pilot Time Slot in Sub‑Frame 1 in dBm or Watts.
Transmit Off Power
The mean power measured over a 70 μs window in the transmitter OFF period.
Cell ID
Identifying information sent by the transmitter in the sync signal.
Timing Error
The error in time between the external trigger input signal and the start of the frame. The Timing Error is only displayed if Triggering is set up to use an external trigger signal to act as a timing reference.
ACLR
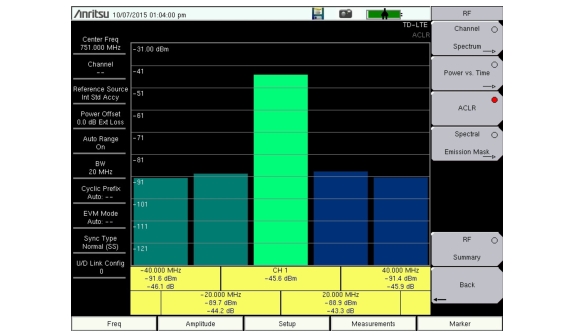
ACLR (Adjacent Channel Leakage Ratio) is defined as the ratio of the amount of leakage power in an adjacent channel to the total transmitted power in the main channel and is displayed in table format under the bar graph. The ACLR screen displays the main channel power and the power of two adjacent channels on each side as a bar graph. For example, when BW is set to 10 MHz, the channel spacing is – 20 MHz, – 10 MHz, + 10 MHz and + 20 MHz and the channels are color coded.
Spectral Emission Mask
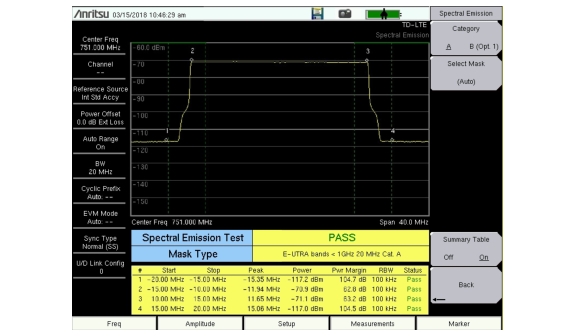
The Spectral Emission Mask (SEM) measurement supports the testing for “Operating Band Unwanted Emissions” described in the 3GPP TS 36.141 Base Station Conformance testing document. There is support for Category A and Category B (Option 1 only) masks which are automatically selected based on the current carrier frequency/channel and BW values.
The instrument indicates if the signal is within the specified limits by displaying PASS or FAIL. The emission mask information is also displayed in a table format with different frequency ranges and whether the signal PASSED/FAILED in that region.
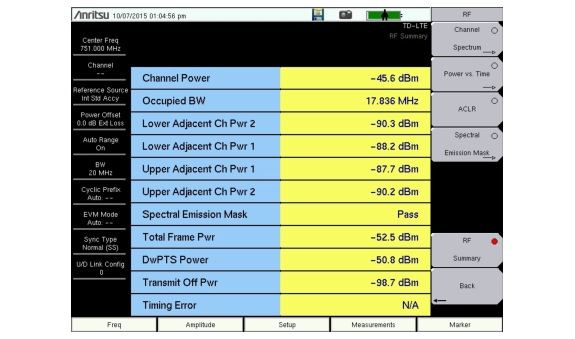
RF Summary
The RF Summary is a display of the occupied bandwidth, power of the main channel, upper adjacent channels, and lower adjacent channels in a table format. The RF Summary also shows the SEM status: PASS or FAIL. Refer to individual RF measurement descriptions for additional details on each measurement.
RF Measurement Setups
Channel Spectrum
1. Press the Measurements main menu key.
2. Press the RF submenu key.
3. Press the Channel Spectrum submenu key to activate this RF measurement view (Figure: Channel Spectrum).
4. Press the Channel Spectrum submenu key again to select the Channel Spectrum menu, where you can adjust the span.
Channel Spectrum
5. Press the Back submenu key to return to the RF menu.
Power vs. Time
1. Press the Measurements main menu key.
2. Press the RF submenu key.
3. Press the Power vs. Time submenu key to select measurement.
4. Press the Power vs. Time submenu key again to set the View and Sub‑Frame Number parameters.
Power vs. Time
5. Press the Back submenu key to return to the RF menu.