This example demonstrates how to calibrate the instrument and make a measurement.
1. Set the frequency range to cover the range of the DUT being tested. In this example, the center frequency is set to 1.96 GHz with a 500 MHz span.
2. The Tracking Generator can become slow if sweep detection is set to any method other than Sample. To set the detection method to Sample, press the Shift key, then the Sweep (3) key. Then press the Detection submenu key and press Sample for the fastest sweeps.
3. Press the Shift key, then the Measure (4) key.
4. Press the More submenu key to open the Measure 2/2 menu.
5. Press the Tracking Generator submenu key.
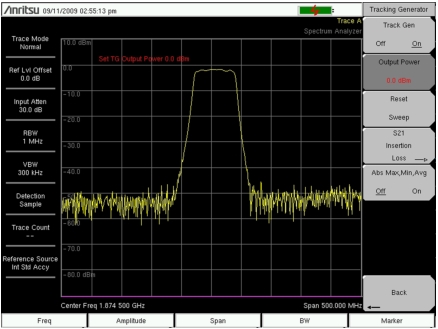
6. Press the Track Gen Off/On submenu key to turn on the output of the tracking generator (the current state, On or Off, is underlined on the submenu key display).
7. Press the Output Power submenu key and set the output power for the device that is being measured, from 0 dBm to – 40 dBm, in 0.1 dB steps. In this example, which is measuring a band pass filter, the power level is set to 0 dBm in order to get the maximum signal through the filter. (The band pass filter that was used in this example is similar to the 1850 MHz to 1910 MHz, 50 ohm band pass filter, Anritsu part number 1030‑111‑R).
8. Connect the DUT between the RF Out and RF In connectors on the instrument. Use good quality cables and adapters to make the connections.
9. Observe the measurement to confirm that the frequency range covers the frequency range that was intended.
Measurement Before Normalization
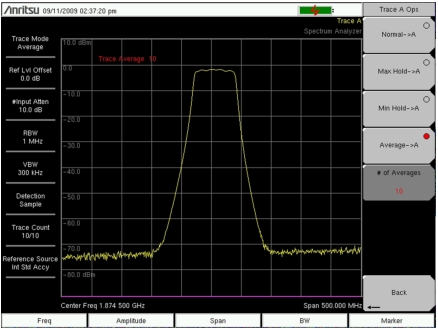
10. If the spectrum analyzer noise floor is too high for the necessary measurements, then reduce the input attenuation and RBW to maximize the dynamic range. Probably, the scale will need to be changed from 10 dB/division to a higher value to see the stop band of a good filter. In this example, the scale is changed to 15 dB/division in Step 17 (as shown in Figure: S21 Scale Changed to 15 dB/division).
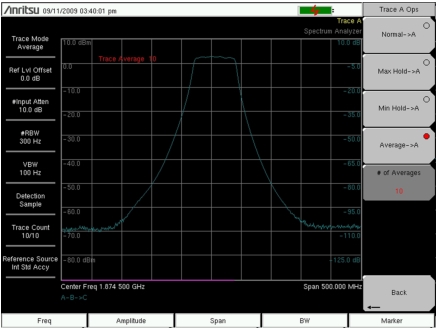
11. When measuring a filter with a very high insertion loss in the stop band, press the Shift key, then the Trace (5) key. Press the Trace A Operations submenu key, then the Average → A submenu key to turn on averaging and clean up the stop band area. An averaging value of 10 will probably be adequate for most filters.
Instrument Set for Good Measurement Before Normalization
12. After the frequency range and other settings are satisfactory, disconnect the DUT and make a THROUGH connection between the RF Out and RF In connectors. For the most accurate results, use the same cables and adapters for this connection as were used to connect the DUT.
13. Confirm that the display shows a nearly flat signal when the THROUGH is connected. If the signal is not reasonably flat, then verify that the cables and connections are in good condition and that the connectors are properly tightened.
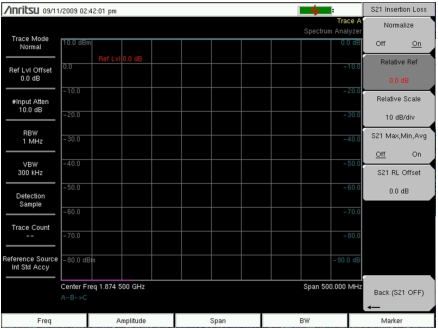
14. Press the S21 Insertion Loss submenu key.
15. Press the Normalize submenu key to set Normalization On (the current state, On or Off, is underlined on the submenu key display).
Flat Sweep After Normalization (Relative Scale at 10 dB/division)
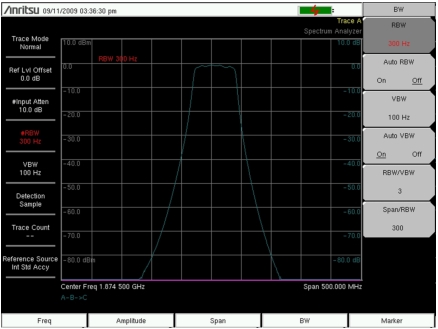
16. Figure: Flat Sweep After Normalization (Relative Scale at 10 dB/division) shows the THROUGH measurement after normalization. Note the relative scale numbers on the graticule lines (in increments of 10 dB) on the right side of the sweep window now that Normalization is ON. If desired, the resolution bandwidth and video bandwidth can be changed after normalization without needing to renormalize. If the input attenuation is changed, then a new normalization sweep is required. After the normalization sweep is finished, reconnect the DUT between the RF Out and RF In connectors. Figure: Measurement After Normalization (Relative Scale at 10 dB/division) shows the filter measurement after normalization.
Measurement After Normalization (Relative Scale at 10 dB/division)
17. If necessary, press the Relative Scale submenu key and change the scale to view the entire measurement.