There are four signal related display windows: Power vs. Time, Instrument Trace Display, Real-time Power Meter, and Power Scale.
Power vs. Time
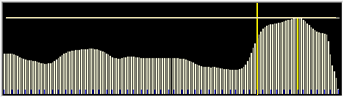
Power vs. Time Display
Run Mode
During run mode, Power vs. Time displays the power levels in sequential time order with the time sequence starting at the left and the latest reading on the right. The signal with the highest power level is highlighted in bright yellow. When the window is full, the signal bars will reduce in width so that the entire collected data is always visible. The horizontal cross hair is another visual indicator of the amplitude of the highest signal level. Data to the Power vs. Time display updates about 1 time per second.
Pause Mode
Place the MIH program in Pause Mode to review the data collected. Click on a signal bar and the vertical cross-hair will move to that position. On the map, the Green Car will move to the breadcrumb associated with that signal bar and the Power Level, Longitude, Latitude and Counter 1 information will be displayed. Place the cursor on the Power vs. Time display area and right-click the mouse. A pop-up menu is displayed to assist you in reviewing the collected data:
Peak Search: Places the vertical cross hair on the highest level signal bar and the Green Car on the breadcrumb on the map with the highest signal level.
Delete Selection: During data collection, large amounts of insignificant data could be collected filling the Power vs Time display with not useful signal bars. Delete Selection allows you to remove signal bars not useful in determining the location of an interferer.
1. Click on the left most signal bar of the group of signal bars to delete.
2. Drag the cursor to the right of the unwanted signal bars.
3. Right-click
4. Click Delete Selection on the pop-up menu. The highlighted section is deleted.
Trim to Selection: Keep a section of the signal bars collected. Click on the left most signal bar of the group of signal bars to keep. Drag the cursor to the right of the signal bars to keep, right-click then click Trim to Selection on the pop-up menu. The signal bars surrounding the highlighted section are deleted.
Delete All: Removes all of the signal bars from the Power vs. Time display and all data from the active data set. Right-click to open the pull down menu. Click Delete All.
Note
For both Run Mode and Pause Mode, light yellow signal bars and short black hash marks are displayed. The light yellow signal bars are a result of crowding. As more signal bars are added to the display, some will overlap creating a light yellow signal bar. The short black hash marks indicate the actual values used in calculating the position estimate.