The map pane may be a map provided by Baidu maps or one that you have downloaded from OpenStreetMap. On the map are various icons and markers used to indicate your position and also help locate the interference source. The map icons and markers are only drawn when data collection is active.
The Map
• Baidu Maps: Using Baidu as the map source requires an Internet connection while you are driving. Click Run. The Baidu maps will discover the vehicle’s current location and display the map for that area.
• Open Source Maps: Downloaded maps from OpenStreetMap does not require an Internet connection when running Mobile InterferenceHunter. Depending on the coverage area or the number of locations that are tested for interfering sources, multiple maps may need to be downloaded onto the tablet or laptop. See Product Information and Map Sources in Help for more details on using maps from OpenStreetMap.
• Image Maps (User Provided): User created maps stored at the C:\[user documents folder]\Anritsu MapFiles location. These are retrieved and opened by selecting Settings > Map Source > Open Map Image File or Installed Map Image File.
The Green Car
It represents your position on the map as you drive. When data collection is paused, click and move the yellow vertical marker in the Power vs. Time Bar Graph in the upper pane and reposition the car icon to a location of interest, for instance peak power locations. The data for the Real-time Power Meter, the Status Bar Power Level, Longitude and Latitude, and Power vs. Time Bar Graph counters will update with the car’s geographical position.
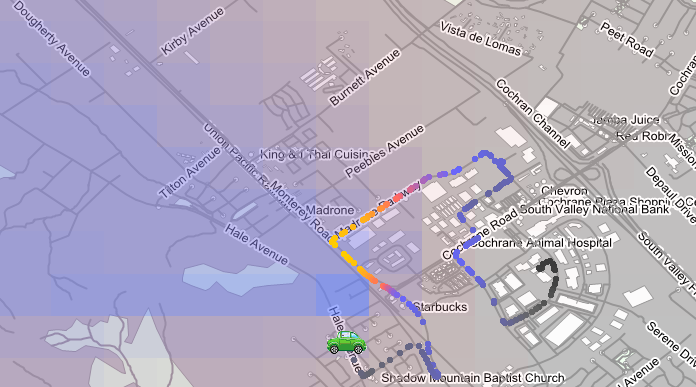
Breadcrumbs
Dots or small circles placed on the screen following the movement of the Green Car. It is the data collected – GPS coordinates and received power at each location. The color of each dot will be set in reference to the color and power level of the Power Color Scale. To see the dots during drive test, set them to grow in size as the power level increases. Click on Settings in the Menu Bar and click on Growing Breadcrumbs.
Cross Hairs
The horizontal and vertical lines intersect at the estimated location of the interferer.
Green Arrows
Once you have collected several data points, an arrow will appear on screen. This arrow indicates a suggested direction of travel towards the interfering signal. The arrow will be in one of three states: Forward, Backward, or two sideways arrows. If the current trend is increasing power the arrow will point forward. If the trend is decreasing power or moving away from the interfering signal, the arrow will point backward. If the trend in the power if fairly level, then you are probably moving more or less perpendicular to the direction of the interferer. This arrow will point in both directions, right and left. This is an indication that the location algorithm needs data in a different direction in order to make a decent approximation of the interferer location. Once you have enough data for Mobile InterferenceHunter to make an approximation of the interferer location, the direction arrows will be removed and either an Estimation Circle or Heat Map will be drawn. The Green Arrows are only available in Spot Mode.
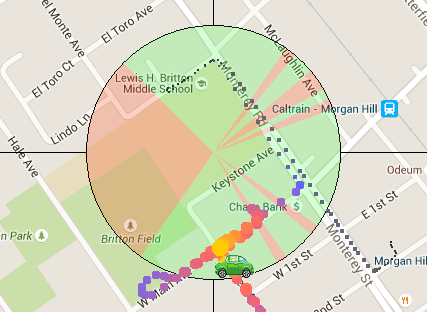
Heat Map
The Heat Map covers a larger area of displaying the level of intensity of the interferer signal by color. A matrix of rectangles creates the heat map and the colors signify the probability that the pattern of observed power measurements would be caused by an emitter in that grid cell – green represents the strongest signal and pale blue/gray represents the weakest signal. For Drive Map Display, click to view either the Estimation Circle or the Heat Map. The Estimation Circle is the default view.
Heat Map with Breadcrumbs
Estimation Circle
A colored Estimation Circle appears as more breadcrumbs with higher power levels are left on the map. When the position of the signal source becomes available, the Green Arrow is eliminated and replaced by the Circle. The Circle may be large at first but will reduce in size as more signal data is accumulated. This indicates that you are closer to the interfering signal source and that the power level of the interferer is increasing. Also, the default colors of the circle area, red and green, can be changed in the Color Mode setting. From the center of the circle looking out, the green areas of the circle depict how the breadcrumbs are dispersed for calculating the location of the interfering signal. If the Circle is heavily shaded red or one side of the Circle is a quarter to half shaded green then drive in the direction of the area shaded red to accumulate a more even distribution of breadcrumbs to calculate the location of the interferer. The Estimation Circle is not available in Multiple Emitter and Spectrum Clearing Modes. For Drive Map Display, click to view either the Estimation Circle or the Heat Map. The Estimation Circle is the default view.