Higher Order IM Measurements (Options 194, 600, or 902)
When low frequency bands are combined with high frequency bands on a common feed system, higher order intermodulation (IM) products can become a concern. PIM Master Options 194, 600, and 902 were developed to allow direct measurement of these higher order IM products (within the upper band receiver frequency range of the option) created by two transmit tones. The remainder of this section discusses an IM2 measurement with Option 902 using the frequency range of 1877 MHz to 1920 MHz and two 900 MHz transmit tones as an example. The principles apply similarly to the other options.
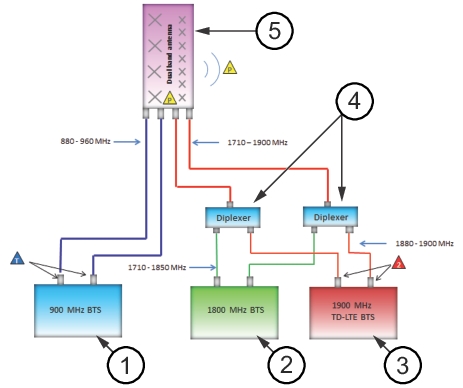
Example PIM Sources and IM2 Products
1.
900 MHz BTS
2.
1800 MHz BTS
3.
1900 MHz TD‑LTE BTS
4.
Diplexer
5.
Dual band antenna
Locations where 900 MHz test tones are injected
Locations where IM2 can be measured
PIM Locations that could generate harmful IM2 PIM on the antenna surface PIM beyond the antenna
A typical site where IM2 might be a concern is shown in Figure: Example PIM Sources and IM2 Products. At this example site, 900 MHz, 1800 MHz, and 1900 MHz signals are sent and received through a dual band sector antenna. The 900 MHz signals are fed to the low frequency band ports of the antenna. The 1800 MHz and 1900 MHz signals are combined and fed to the high frequency band ports of the antenna.
PIM sources in the 900 MHz feed system (blue lines from the 900 MHz BTS in Figure: Example PIM Sources and IM2 Products) will generate a full array of IM products (IM2, IM3, IM4, IM5, and so forth). Those products that fall within the 900 MHz uplink band will return to the 900 MHz receiver and potentially impact site performance. Those products that fall outside the 900 MHz uplink band (such as IM2) will be blocked by filters inside the 900 MHz BTS receiver and will not impact performance.
These same IM products will couple through the antenna elements and travel down the high frequency band path to the 1800 MHz and 1900 MHz receivers. Before entering the 1800/1900 MHz feed system (red lines from the antenna elements to the diplexers in Figure: Example PIM Sources and IM2 Products), the IM products will be attenuated by the band-to-band isolation of the antenna. This isolation is typically on the order of 50 dB, meaning that PIM generated in the 900 MHz feed system is attenuated 50 dB before entering the 1800/1900 MHz feed system. This means that IM2 generated in the 900 MHz feed system is unlikely to be at a high enough level to impact 1900 MHz performance.
PIM sources that can be a problem are those on the antenna surface or beyond the antenna that can be illuminated by both the high band and low band radiating elements. These PIM sources are excited by the 900 MHz downlink signals, and generate IM2 signals that radiate directly back into the high frequency band elements. This radiation path is low loss, allowing the IM2 signals to enter the 1900 MHz path at a high level, potentially impacting site performance.
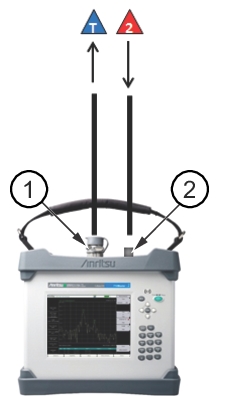
As shown in the site configuration, IM2 that is capable of impacting 1900 MHz performance must be measured on the 1900 MHz path (red lines) while transmitting 900 MHz test tones into the 900 MHz path (blue lines.) The PIM Master supports this measurement by providing two separate test ports on the instrument (see Figure: PIM Testing for IM2 Products). One test lead connects the PIM test port to the 900 MHz feed line, and a second test lead (available with Option 902) connects the IM2 In port to the 1900 MHz feed line. While transmitting 900 MHz signals, the PIM Master measures the magnitude of the IM2 products arriving at the 1900 MHz BTS.
PIM Testing for IM2 Products
1.
PIM test port (900 MHz test tone Tx)
2.
IM2 In test port (Rx only)
Locations where 900 MHz test tones are injected
Locations where IM2 can be measured
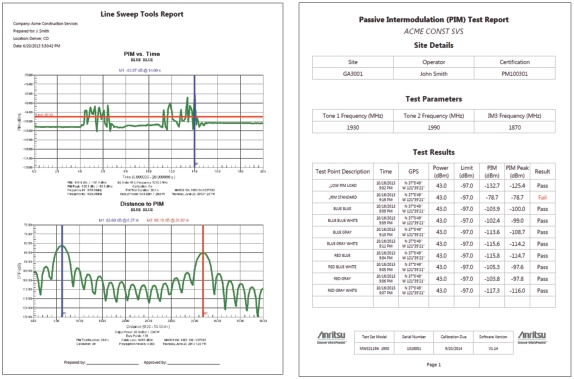
Test Reports
Use Line Sweep Tools (LST) to view and create reports from saved measurements. Line Sweep Tools can generate a standard report showing plots of the measured results. LST can also generate a special PIM report to display PIM versus TIME or Swept PIM results in a tabular format.