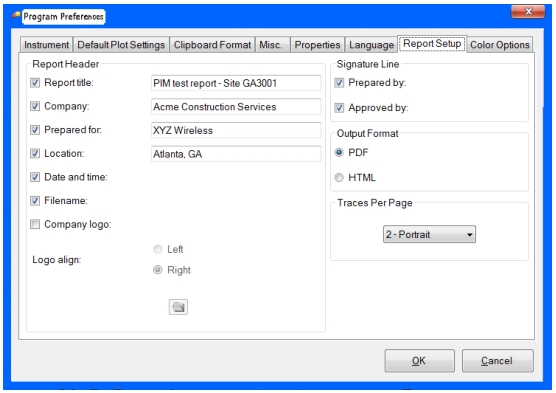
To use the report generator in Line Sweep Tools, go to File menu and select Report Setup to determine how you want the report to appear. In the example in Figure: Report Setup Tab, the report is set up to include the name of the contractor that did the work (Company field), the company for which the report is prepared, and the testing location. The report will be generated in PDF output format.
Report Setup Tab
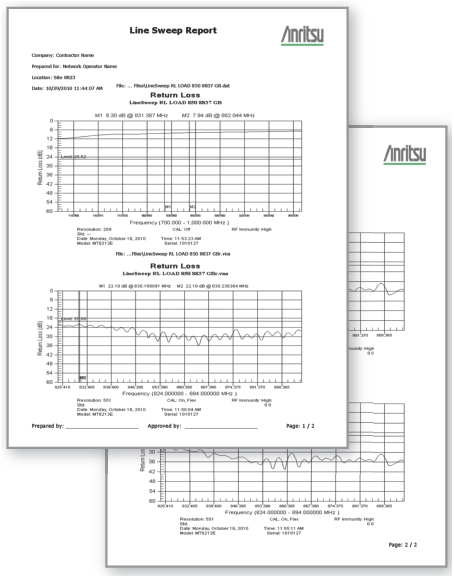
When the report generator is set up, File > Generate Report creates the output PDF. The report will include all traces that were open (in LST) at the time the report was made.
The following sections describe graphical and tabular report options.
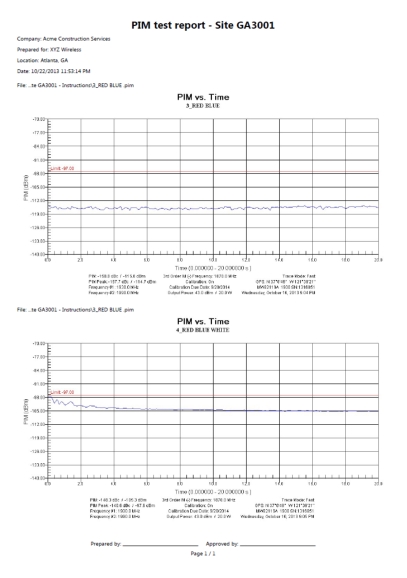
For PIM reports that include PIM vs. Time, Noise Floor, Distance to PIM, and Swept PIM, use the LST standard report generator.
1. Open all of the measurements that are intended to be in the report.
Note
Open these measurements files in the order in which you want them to appear in the report.
2. Adjust limit lines, scale, markers, and titles as desired.
3. Go to File > Report Setup to specify the desired appearance of the report (See Figure: Report Setup Tab). Select the desired report header fields, the signature line options, the output format, and the number of traces to appear on each page. Then select OK.
4. Go to File > Generate Report to create the output report. A window opens to provide you with the opportunity to name the report and to choose the save location. Then select Save.
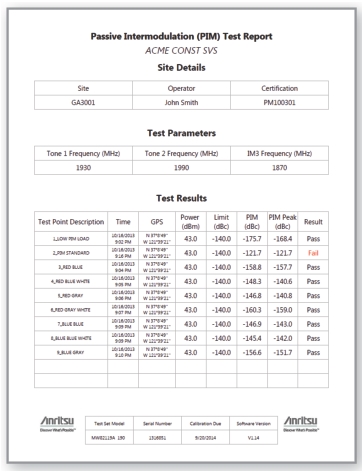
You can generate a summary Pass/Fail PIM report in tabular format using the LST PIM Report Creator Feature. This report compares the peak PIM values to the limit setting for each PIM vs. Time measurement, and produces a Pass/Fail result.
Note
Only PIM vs. Time measurements that are OPEN will appear in this tabular PIM Report.
Other PIM measurements and C&AA measurements will not appear in this tabular PIM report.
1. Open all of the PIM vs. Time measurements that you intended to have in the report.
Note
Measurements will appear alphabetically in the report based on the subtitle field. Adjust this field as desired on each measurement to change the report order.
2. Adjust limit lines, scale, markers, and titles as desired.
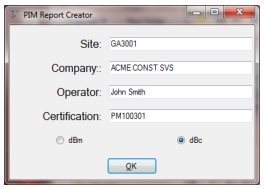
Go to File > Reporting > PIM Report Creator (see Figure: LST PIM Report Creator) to populate the report header fields and to select the report measurement units (dBm or dBc). Then select OK.
LST PIM Report Creator
3. A window opens to provide you with the opportunity to name the report and to specify the save location. Select Save. See Figure: Generated Tabular PIM Sweep Report for a report example.