 |
|
Mode/Measurement Type | Key 1 | Key 2 | Key 3 | Key 4 | Key 5 |
|---|---|---|---|---|---|
PIM vs. Time | Freq | Amplitude | Setup | Measurements | Marker |
Noise Floor | Freq | Amplitude | Setup | Measurements | Marker |
DTP | Distance | Amplitude | Setup | Measurements | Marker |
Swept PIM | Freq | Amplitude | Setup | Measurements | Marker |
High Accuracy Power Meter1 | Amplitude | Average | Zero / Cal | Limit | |
Cable & Antenna | Freq/Dist | Amplitude | Sweep/Setup | Measurements | Marker |
 2- 2- |
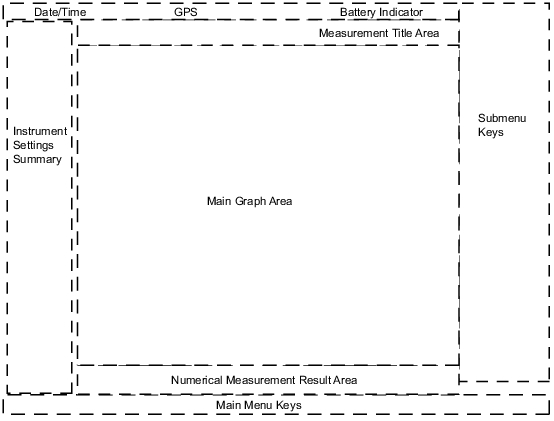
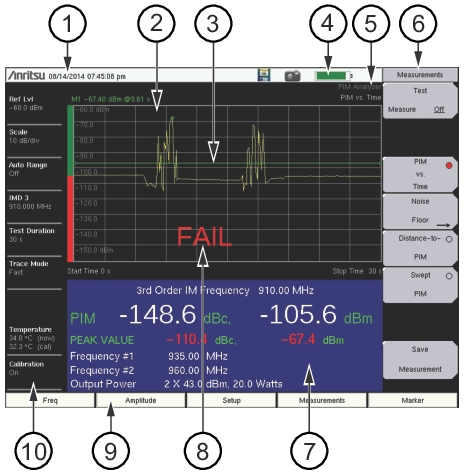
1. | Real Time Clock (followed by GPS Coordinates if Option 31 is installed) |
2. | Main Graph Area or Sweep Window or Measurement Grid |
3. | Limit Line (Green line, set from Limit menu) |
4. | Battery Status Icon |
5. | Instrument Mode and Measurement Title |
6. | Submenu Keys or Active Function Block |
7. | PIM Summary Table |
8. | Pass/Fail Indicator (set from Limit menu) |
9. | Main Menu Keys |
10. | Instrument Settings Summary |
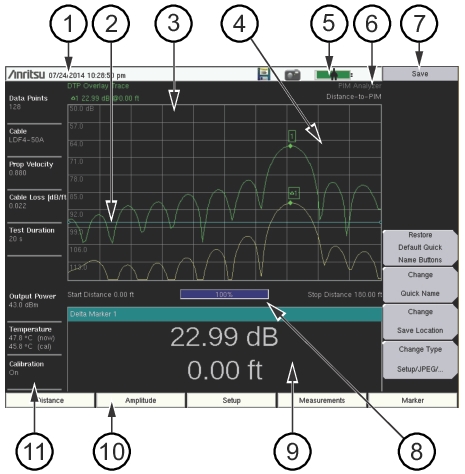 |
1. | Real Time Clock (followed by GPS Coordinates if Option 31 is installed) |
2. | Reference Limit Line (blue line, set from Limit menu) |
3. | Main Graph Area or Sweep Window or Measurement Grid |
4. | Marker on Distance‑to‑PIM Measurement Trace |
5. | Battery Status Icon |
6. | Instrument Mode and Measurement Title |
7. | Submenu Keys or Active Function Block |
8. | Progress Indicator |
9. | Marker Table (set to Large) |
10. | Main Menu Keys |
11. | Instrument Settings Summary |
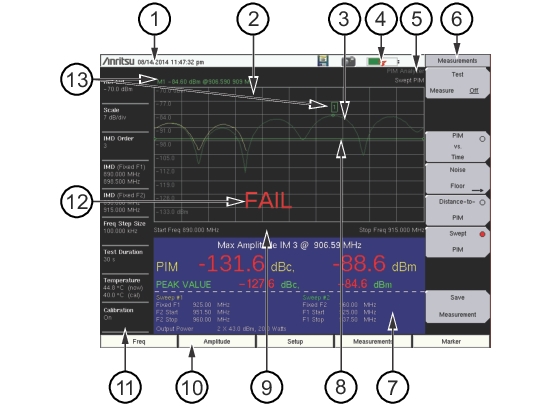 |
1. | Real Time Clock (followed by GPS Coordinates if Option 31 is installed) |
2. | Main Graph Area or Sweep Window or Measurement Grid |
3. | Swept PIM Measurement Trace (green trace and yellow trace) The yellow trace is created by holding F1 fixed and sweeping F2. The green trace is created by holding F2 fixed and sweeping F1. The PIM Summary Table displays the frequencies that are used to generate each sweep. In this display, the green trace (Sweep #2) is visible only in the first few MHz of the sweep. Note that the PIM Summary Table displays the Sweep numbers in yellow and green. |
4. | Battery Status Icon |
5. | Instrument Mode and Measurement Title |
6. | Submenu Keys or Active Function Block |
7. | PIM Summary Table |
8. | Limit Line (green) |
9. | Progress Indicator |
10. | Main Menu Keys |
11. | Instrument Settings Summary |
12. | Pass/Fail indicator |
13. | Marker and marker data automatically displayed |
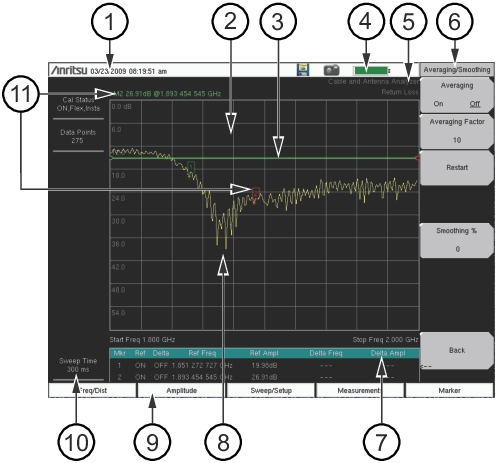 |
1. | Real Time Clock (followed by GPS Coordinates if Option 31 is installed) |
2. | Main Graph Area or Sweep Window or Measurement Grid |
3. | Limit Line (green) |
4. | Battery Status Icon |
5. | Instrument Mode and Measurement Title |
6. | Submenu Keys or Active Function Block |
7. | Marker Table |
8. | Return Loss Measurement Trace |
9. | Main Menu Keys |
10. | Instrument Settings Summary |
11. | Marker and marker data automatically displayed for active Marker [M2] |