 |
 |
Component | Definition |
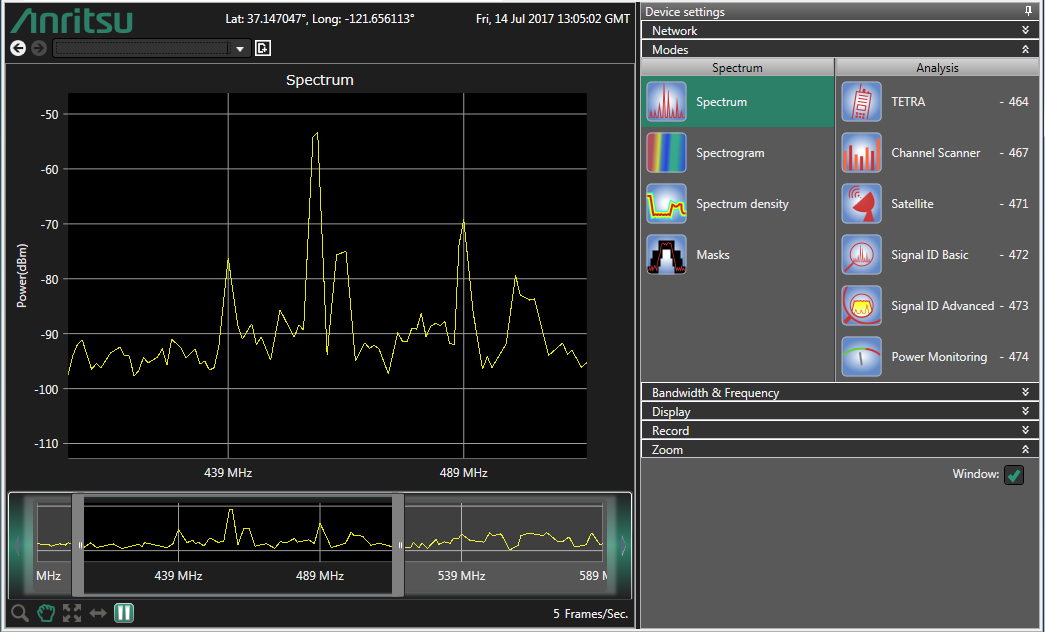
Window | The zoom window allows for displaying a user-defined area of the spectrum chart. The left and right edge of the window can be dragged in order to change the window width. The Zoom window can be seen, in Figure 1-4 Zoom Window, underneath the main spectrum display. |
 |
Component | Definition |
Power Range | Determines the minimum and maximum power values. Power values below the range are displayed in black. Power values above the range are displayed in the top most color. The double slider allows setting a user-defined minimum value and maximum value. Users may also enter minimum and maximum power values in the boxes next to the double slider. |
Color Range | Defines which colors are mapped to the specified power range. |
Time Marker | Allows you to place a Time Marker on the Spectrogram window. Placing two Time Markers will display a third time box with the difference between the two time markers. |
Component | Definition |
Memory Size | The number of spectrums considered in the spectral density increases the spectrum counter. If the counter exceeds the memory size, new spectra will account proportionally to the memory size. Hence, older events are lost over time. |
Color Map | The color map assigns a color range to a range of occurrence probabilities in percentage for the captured power level values. |
Component | Definition |
Mask Settings | Opens the Mask settings dialog to create a new mask or load a previously created mask. E-mail alerts can be sent based on mask threshold violations. The e-mail server must first be set up in SpectraVision to enable this feature. |