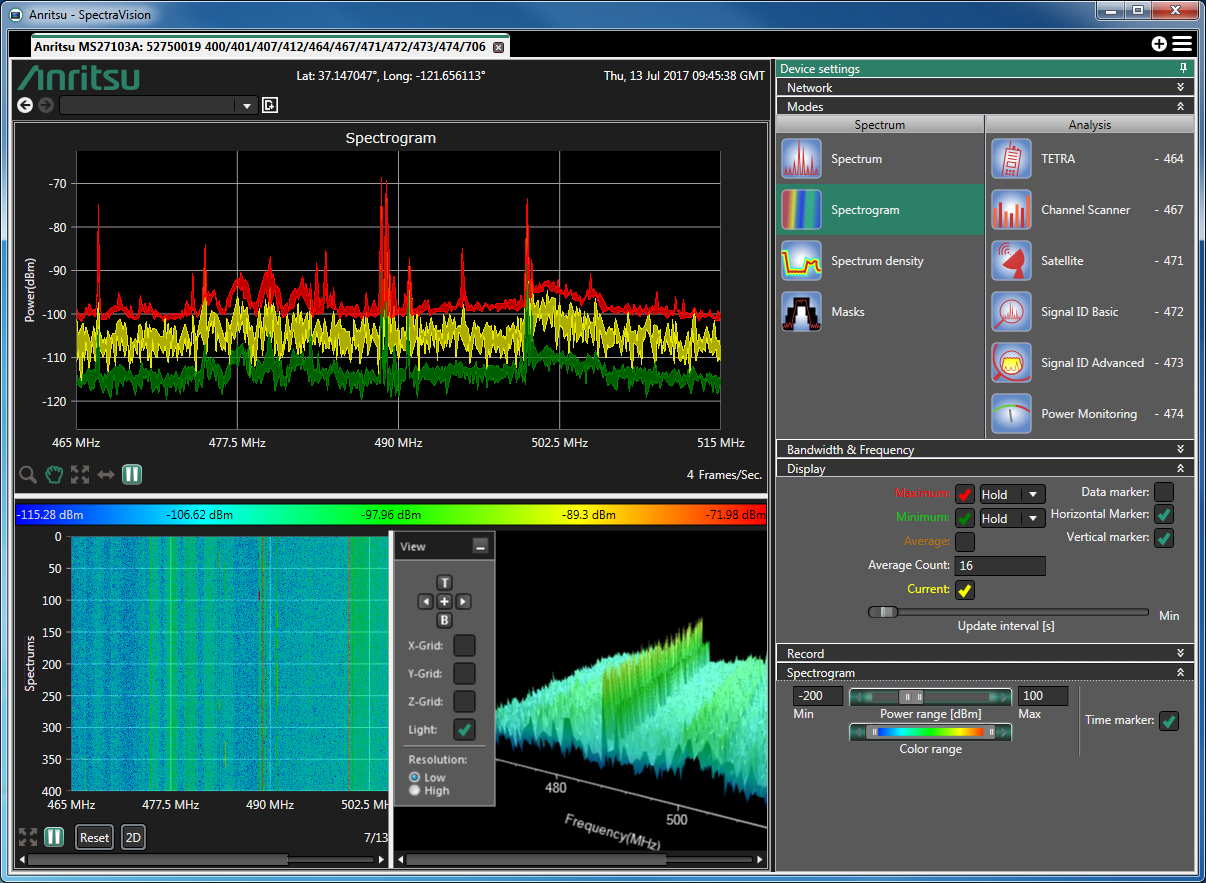
The following screen provides the spectrogram mode working pane.
Spectrogram Window
Spectrum Settings
The spectrum settings are the same as in the spectrum mode (See General Setup)
Spectrogram Panel Settings
When clicking on the Spectrogram icon in the Modes menu, a new Spectrogram tab appears at the bottom right side of the display window.
• Power range (dBm): Determines the minimum and maximum power values. Power values below the range are displayed in black. Power values above the range are displayed in the topmost color. The double slider allows setting a user-defined minimum value and maximum value.
• Color range: Color range: defines which colors are mapped to the specified power range.
• Time marker: Activates time markers in the spectrogram chart. A marker is set by a left mouse click while holding down the “Shift” key.
• Delta Time marker: A Delta time marker can be displayed in the spectrogram window. Set the first marker by holding down the shift key and click the left mouse button. Then move to the second point while continuing to hold down the shift key. With another left mouse click, apply the second marker. A 'delta' marker will then be positioned between the two markers.
Spectrum Chart
You can scroll/browse through the spectrum using the mouse by simply dragging a displayed spectrum chart.
Color Map Bar
The color map is displayed according to the current spectrogram settings. It shows the color values assigned to the specified power range.
Spectrogram
The spectrogram chart is filled from top to bottom where the bottommost line represents the eldest time frame. You can browse through the time frames of a spectrogram by holding down the Shift key and rolling mouse over the spectrogram. In the spectrogram, the selected time frame is highlighted as red line. The time difference between two spectrums can be measured using two time markers inserted by holding down the “Shift” key and a left mouse click on each time frame.
Spectrum and Spectrogram Controls
• The 'Fit Visible Area' (4 arrows icon under the spectrogram chart) will adjust colors for the spectrogram.
• The two double vertical line icon starts/stops the spectrogram measurement.
• Reset: resets the spectrogram and starts drawing a new chart.
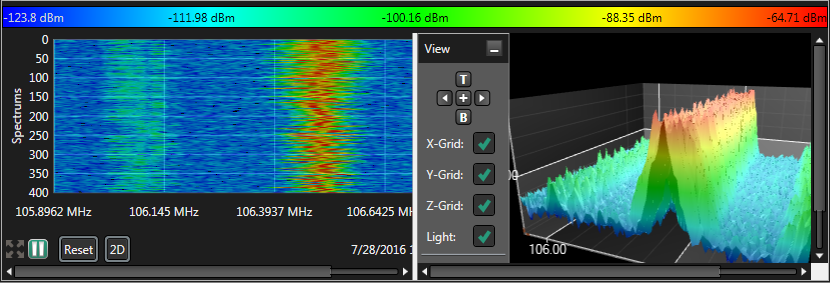
Switching to 3D
After clicking the 3D button, a 3D representation of the spectrogram will appear to the right shown in Figure: Spectrogram 2D & 3D View. Clicking on the 2D button reverts back the window to a 2D-only display.
Spectrogram 2D & 3D View
3D Chart: 3D performance depends on the graphics performance of your PC/laptop. To enhance the performance, you can turn off the light or reduce the resolution. Zoom into the chart by scrolling the mouse wheel or move around by holding down the left mouse button.
As shown in Figure: Spectrogram 2D & 3D View, users can select grid backgrounds for each dimension of the display. Other options include a high or low display resolution.
There are also view selections buttons that can be clicked for the corresponding displays of the 3D spectrogram.
• T - top
• B - bottom
• < - left
• > - right
• + - brings the 3D spectrogram back to its original view.