The TETRA signal analysis mode is organized into multiple sections: TETRA signals, Channel Presets, Identification, Identification Results, and Identification Results (Carrier) Overview.
Tetra Mode Display
Spectrum Settings
The spectrum settings are the same as in the spectrum mode. (See General Setup.)
Detection, Identification and Analysis of TETRA Signals
There are five main windows in the TETRA mode display:
• Spectrum
• Channel Presets
• Identification
• Identification Results
• Identification Results (Carrier) Overview
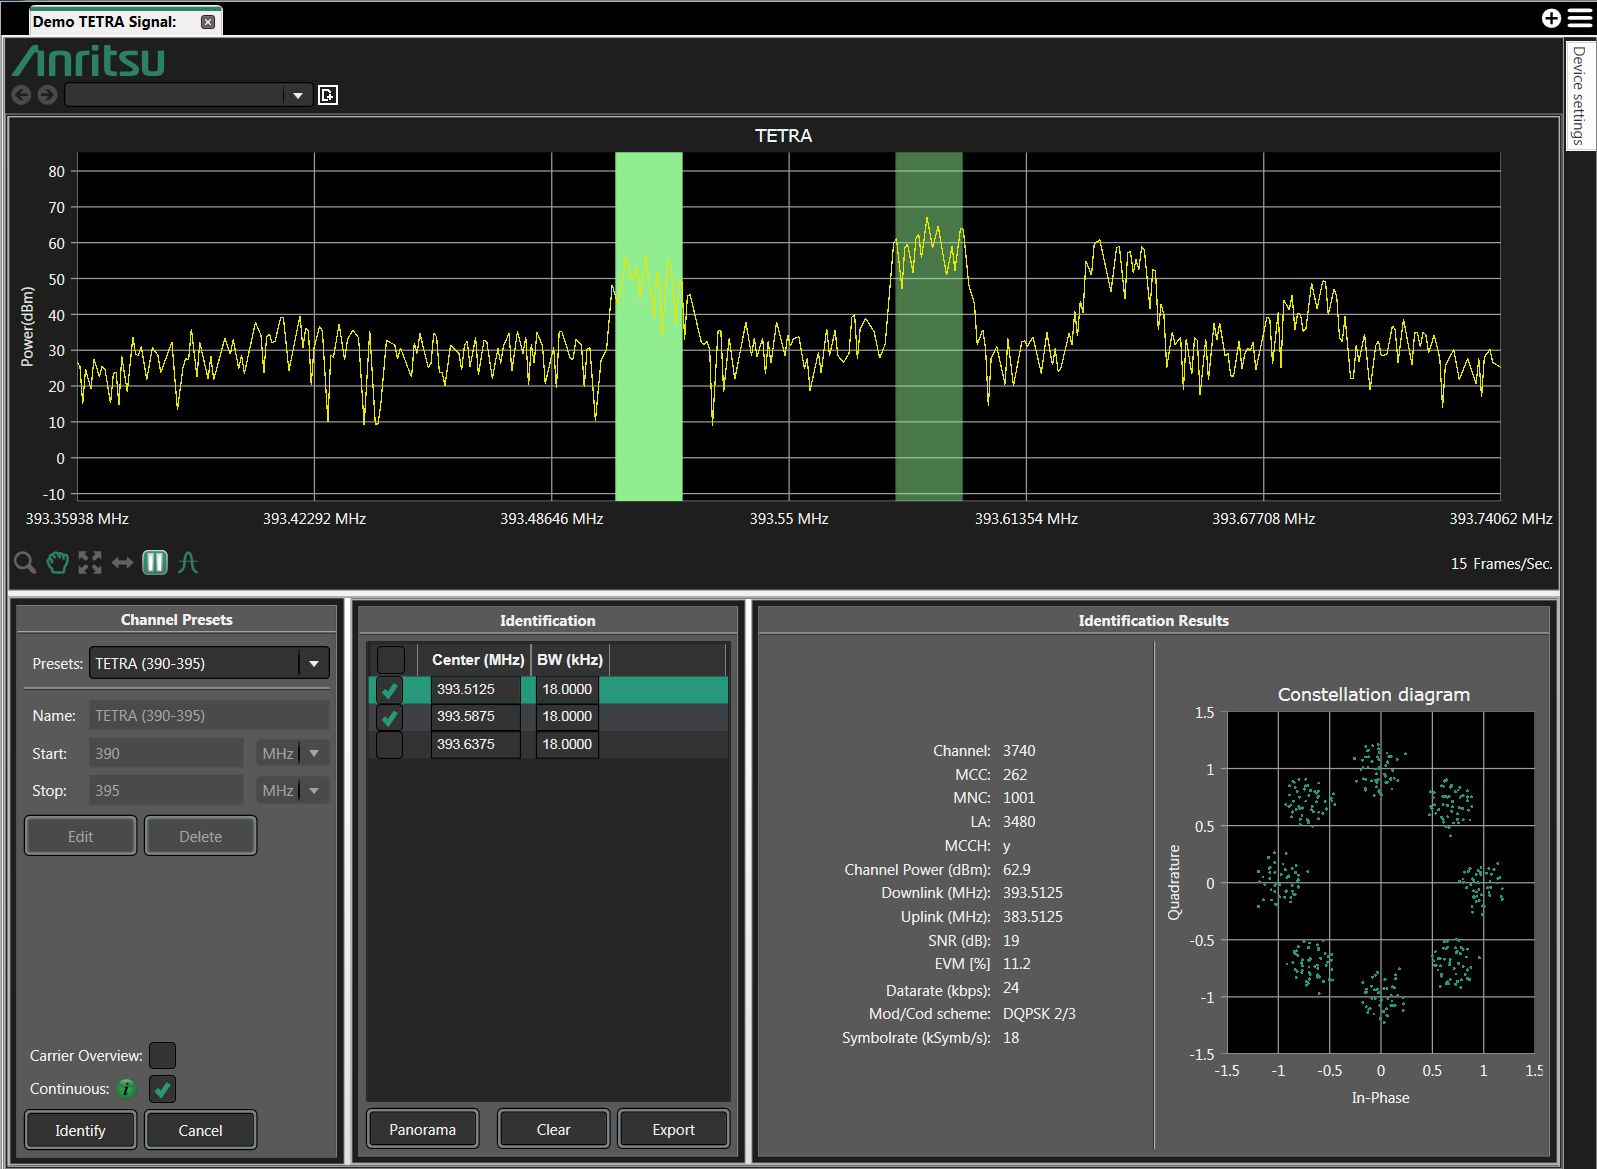
TETRA Mode Display
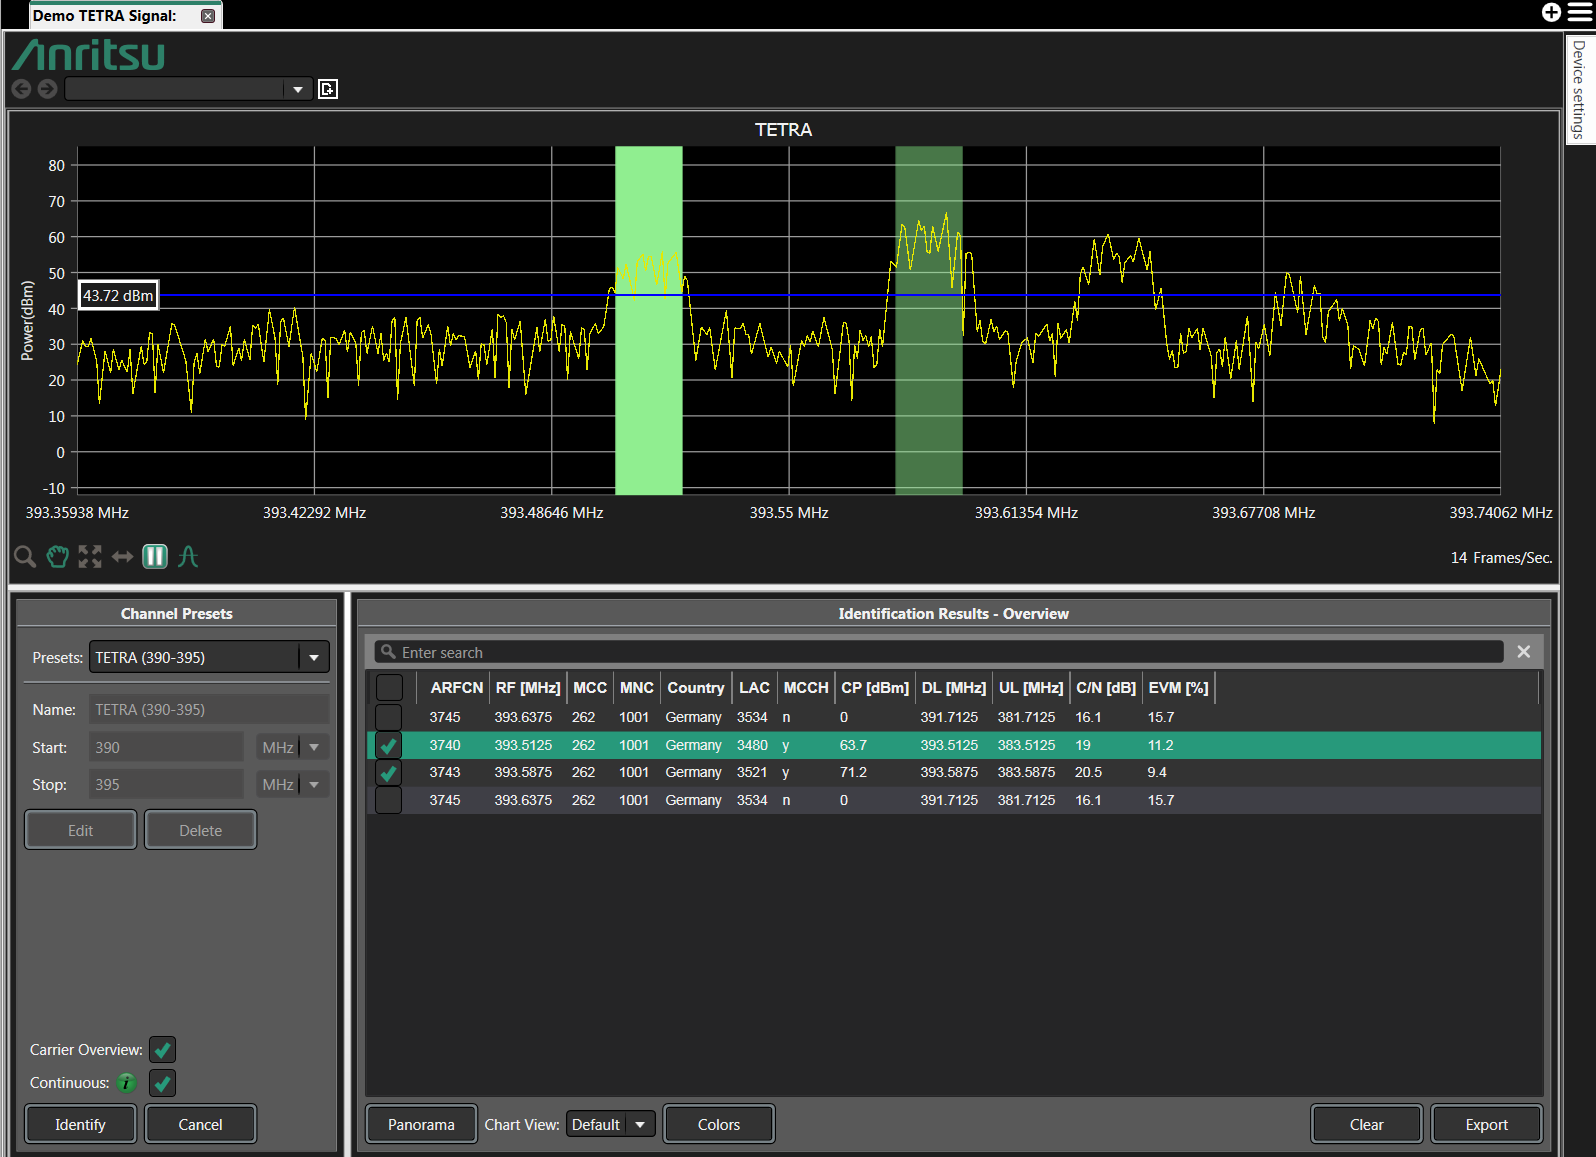
TETRA Mode Display with Carrier Overview
Channel Presets
In the dropdown list, one can either use one of the preset frequency ranges or create your own range to scan (by selecting 'New' in the drop-down list). Users can then name their own scan, set start/stop frequencies and add them to the software database for future use.
Checking the continuous checkbox results in a continuous scan of the selected frequency range to look for and analyze unidentified carriers.
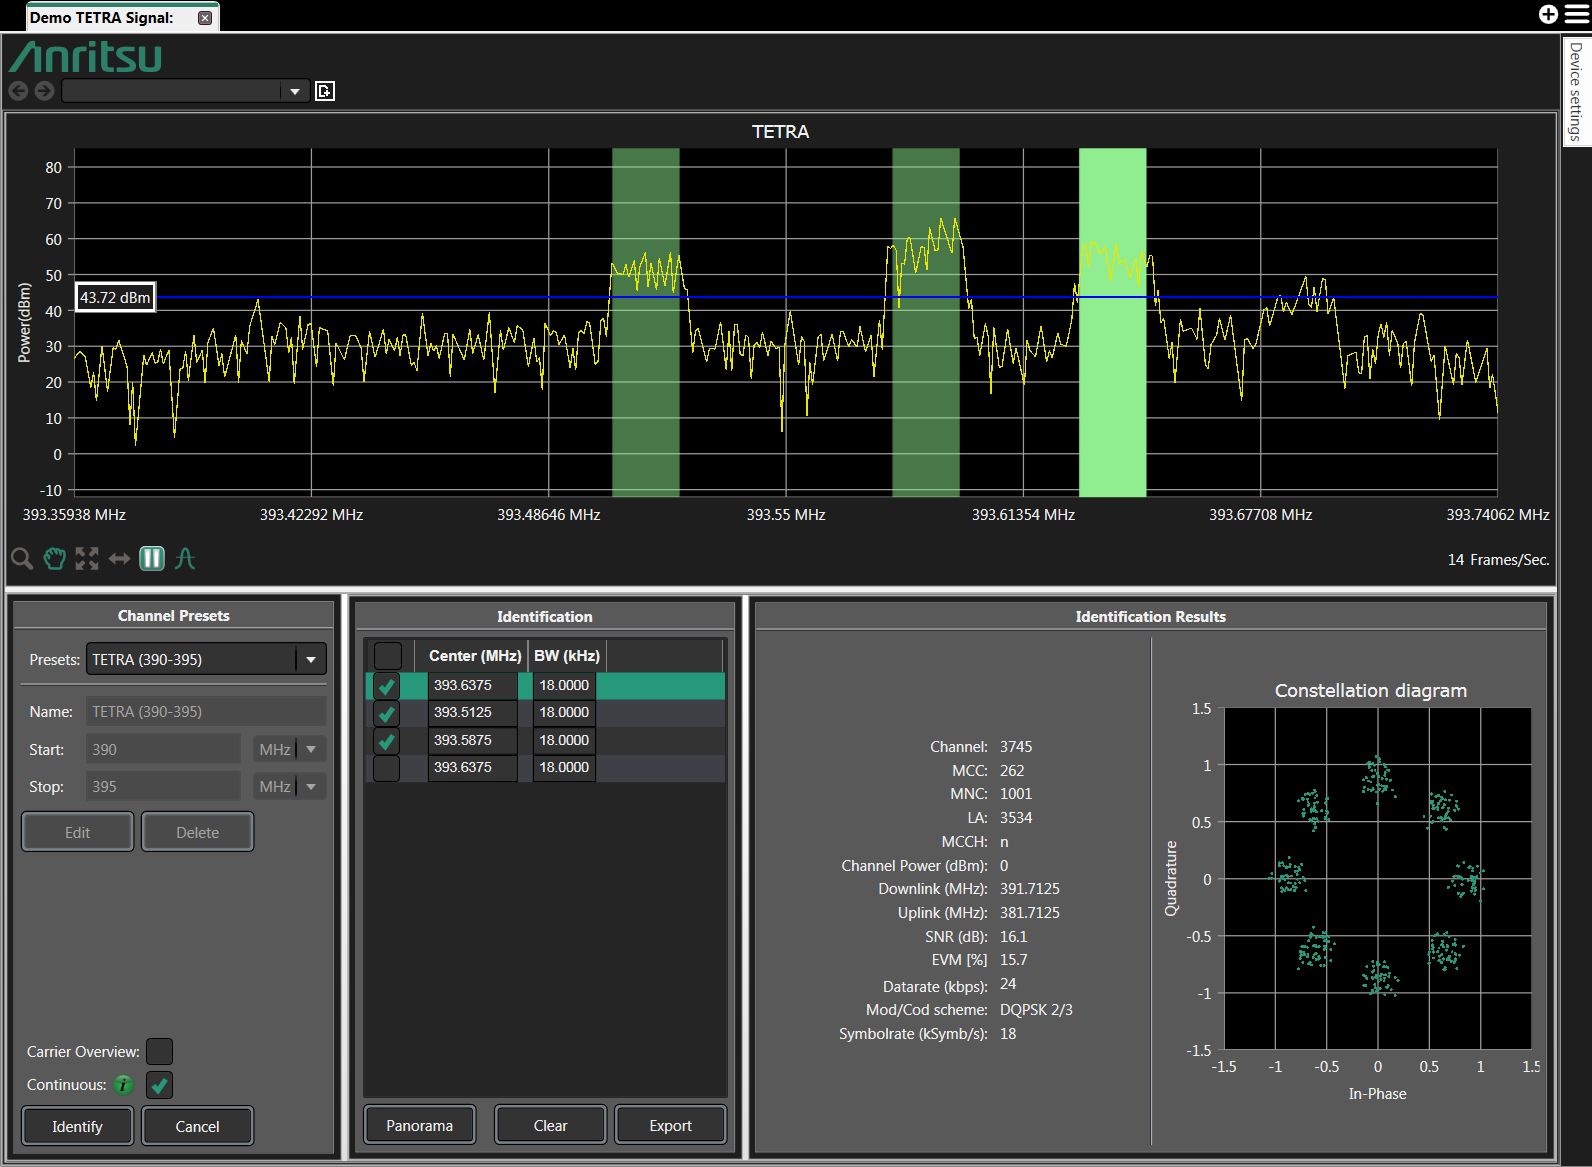
You can add a horizontal threshold for TETRA signals to be captured by holding “shift” and left-clicking the mouse at the power level desired. Signals which fall below this threshold will not be identified. Remove the horizontal line by holding “Shift” and clicking the right mouse button. If a horizontal line is not placed, the scan will then identify all active TETRA signals regardless of amplitude.
Beneath the box for entering the Stop Frequency, you will see a setting called Offset. Even though TETRA is a standardized modulation format, there can be various carrier frequency offsets as defined in clause 21.4.4.1 in EN 300 392-2 [1]. Various countries can adopt their own offsets in their frequency allocation systems. Carrier frequencies can be offset by the following frequencies:
• – 6.25 kHz
• 0 kHz
• +6.25 kHz
• +12.5 kHz
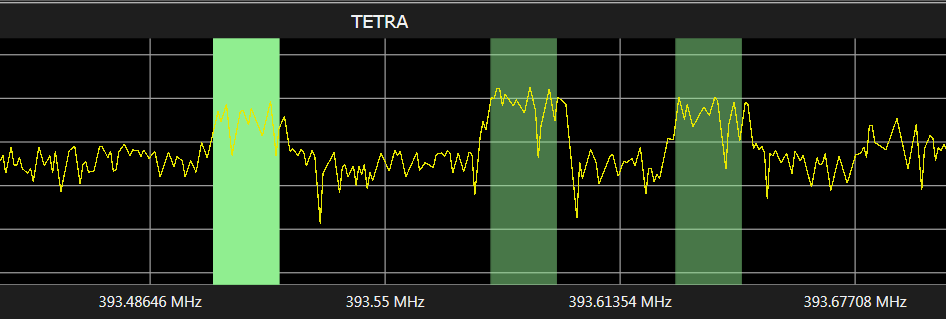
Please use the correct offset frequencies allocated for your country. Users can also observe a TETRA signal on the trace window. When the proper offset is selected, a green rectangular box will be centered on the TETRA signal. See Fig XYZ where a 12.5 kHz offset has been applied.
TETRA Signals with Correct Offset Applied
Once the Channel Presets are complete, click on Identify to begin the frequency scan and identification process.
Identification (when 'Carrier Overview' is unchecked in the Channel Presets window)
Once 'Identify' has been clicked in the Channel Presets window, various carrier frequencies will appear in the Identification window.
Checking the box to the left of each Center frequency will enable a colored rectangle to appear on the TETRA spectrum screen. Clicking inside the box to the right of the Bandwidth column will cause the Identification Results to appear in its respective window. Signal demodulation parameters and a Constellation Diagram will appear in this window for the TETRA signal selected.
To create a PDF or CSV file reporting the results of your scan, click on the Export button at the bottom right of the Identification window. The Panorama button will be discussed later in this manual.
Identification (when 'Carrier Overview' is checked in the Channel Presets window)
The Carrier Overview selection will display a window called 'Identification Results - Overview' to be displayed. Here you can see a listing of all signals captured in the scan with signal parameters such as ARFCN, RF frequency, MCC/MNC codes, EVM percentage, etc. Selecting the 'Colors' button allows users to color code the scanned TETRA signals according to the country of origin.
The Identification window also contains a Clear button, when selected, deletes the highlighted signal in the window.
Panorama Scan
Clicking on the Panorama button at the bottom the Identification windows will produce a new window. See Figure: Tetra Window - Empty Panoramic View below. The Panorama Measurement allows users to measure and record power levels according to a specific Location Area Code (LAC). The field strength of the TETRA carrier as well as all neighborhood cells is recorded. The data is stored in dBm units (along with the location coordinates) as a directional antenna is swept across a 360 degree circle.
Users can choose azimuth precision by selecting the number of degree increments in the drop-down list. Using a directional antenna sweeping in a circle, measurements are taken every 'X' degrees (with 'X' being the Azimuth setting).
Once the measurement is started, a measurement is taken at the 0 degree direction. The Start button will then change to 'Continue'. Each time the Continue button is clicked, a new measurement is taken at a new angle dictated by the azimuth setting.
The Site Survey can then be exported in PDF or CSV file format as a permanent record of the survey.