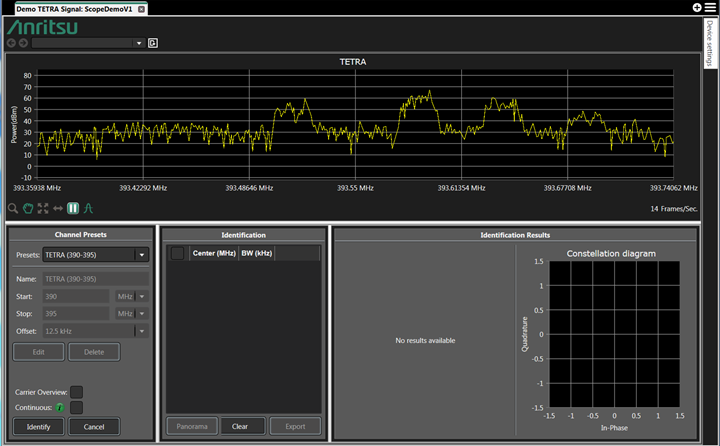
5. In the Channel Presets box (lower-left of the window), insure that Presets are set to TETRA (390-395) in order to cover the frequency range of the demo signal. There are a number of preset signal bandwidths available. Users can also choose to develop and name their own frequency bandwidth.
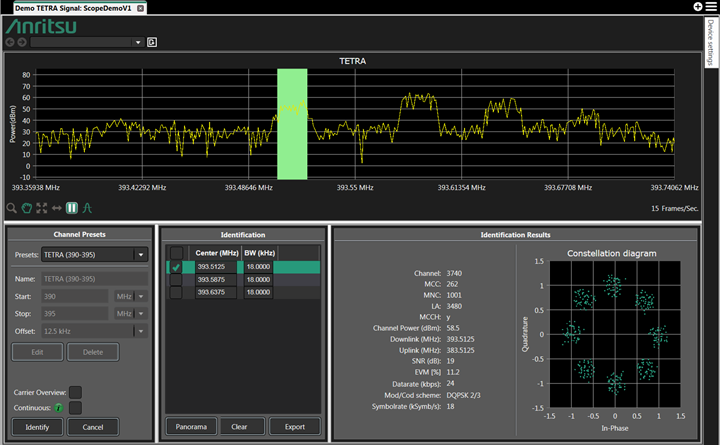
6. Click Identify. The algorithm will then scan and identify any possible signals. Initially there will be many signals shown in the Identification window. However, after the program runs there should be 3 TETRA signals discovered. See Figure: Demo TETRA Signal: Demodulation Parameters and Constellation Diagram.
Demo TETRA Signal: Demodulation Parameters and Constellation Diagram
In the Identification window, users can check on any of the three TETRA signal frequencies displayed. You will notice that a green rectangle appears on the trace screen as each TETRA signal is checked.
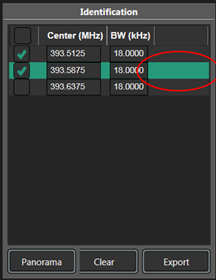
7. To view the demodulation parameters of any of the three signals, click on the bar located to the right of the bandwidth. See Figure: Identification Window for the picture of the Identification window with the ‘bar’ area circled in red.
Identification Window
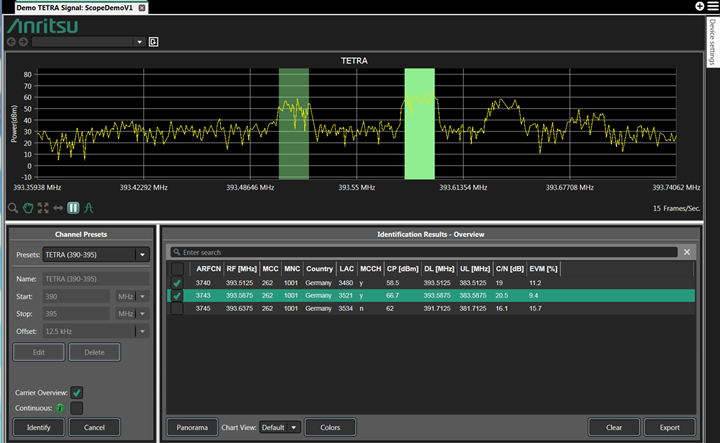
8. Users can also select the Carrier Overview checkbox to view TETRA signal information for all the signals scanned. See Figure: Carrier Overview Window.
Carrier Overview Window
9. Users may also select Colors in the Identification Results – Overview window. Scanned TETRA signals can be color-coded according to country.
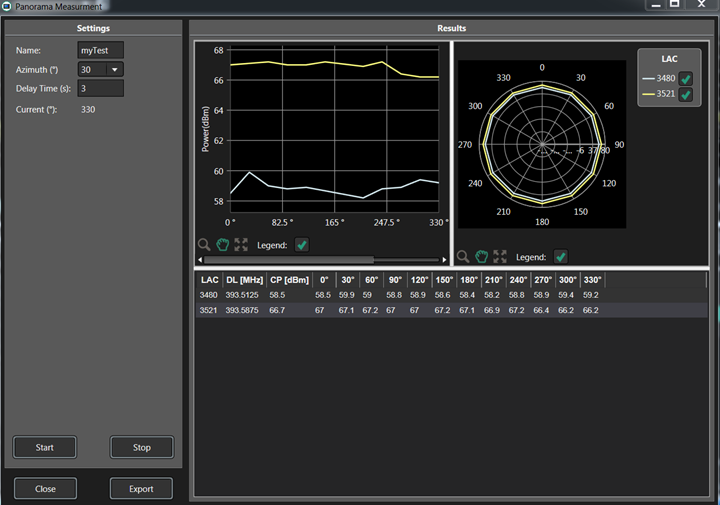
10. Finally, users can select the Panorama button to generate a 360 degree scan of frequencies. In the Settings window, enter a name an Azimuth. Measurements will be taken according to direction of the antenna used. Delay time allows the measurement to dwell in each direction to average measurements.
11. Click Start. The measurement will be made according to the delay time chosen.
12. Click Continue to proceed with measurements at each angle (Azimuth).
13. Once completed, click Export to view the report. See Figure: Panorama Measurement for the illustration of a completed measurement.
Panorama Measurement
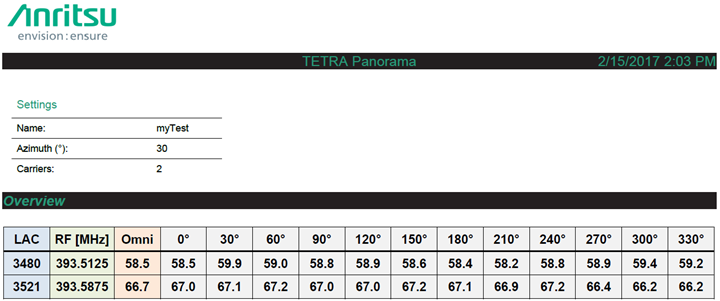
14. Note that this is a demo program only, so measurements for each LAC signal will not vary a lot. Click Export to see report generated in Figure: Panorama Measurement Report.