An occupancy report divides up a frequency range into sub-channels and shows the typical traffic at each sub-channel frequency. Occupancy reports are:
• Typically used to investigate the availability of bandwidth within a particular frequency space or to locate unexpected signals in the frequency space.
• Generated from several hours, days, or weeks of continuous spectrum monitoring data.
• May span multiple databases.
Determine the frequency range of interest and then collect trace data in that frequency space. The target receivers can collect up to 4000 points per trace. You will need to set the number of points such that you have at least one point/sub-channel. If you have more than one point/sub-channel, the highest measured power in the sub-channel is used in the report. For instance, if you are interested in monitoring the 500 MHz to 600 MHz, and you want 25 kHz channel spacing, then you will need at least (600 MHz – 500 MHz)/25 kHz = 4000 trace points.
Occupancy Report Generator works with auto-archived databases or manually created Vision database. Specify the folder location that holds the desired database. Auto-archived databases are stored in a sub-folder of the active database folder. Each archived database has its own sub-folder, named with the date and time stamp at which the archive was created. The databases will be listed on the left side of the report generator window. Each folder is listed by name, and there is a check box next to the folder names to include or exclude particular folders in the generated report.
Generating the Report
To generate the Occupancy Report, click Generate from the Report menu on the main menu bar. It may take several seconds to generate the report, depending on the number of traces and archive folders being processed. There can be a lot of data to process. The lower right-hand corner of the window has a progress bar that indicates the progress through the selected archive databases.
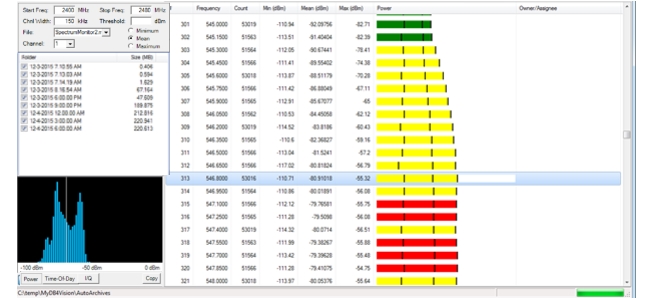
The report includes a pass/fail status for each sub-channel when the power bar is:
Green: Maximum power measured in a sub-channel is below this threshold, the channel passes.
Yellow: Maximum power exceeds the threshold, but the average power is below the threshold.
Red: All saved traces in a given sub-channel is above the threshold.
The power bar for each sub-channel also shows three vertical black lines. The first is the minimum power measured, the second is the mean power, and the third is the maximum power measured for the given sub-channel.
Occupancy Report
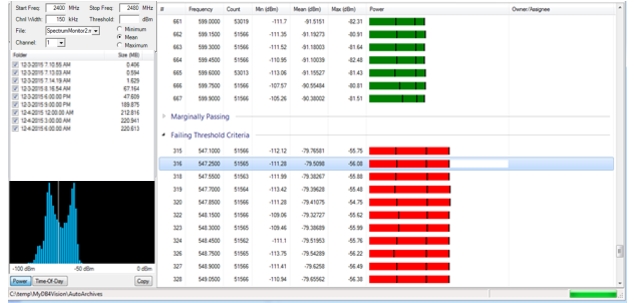
Group Sub-Channels
Normally, the report will show the sub-channels in frequency order. There is an option to group the sub-channels by pass/fail status. To do so, click to toggle “Show By Pass/Fail Status” menu item under the Reports main menu.
To generate the Occupancy Report to appear as shown in Occupancy Reports, click Generate from the Report menu on the main menu bar or press F5 as a shortcut to generate the report. It may take several seconds to generate the report, depending on the number of traces and archive folders being processed. There can be a lot of data to process. The lower right-hand corner of the window has a progress bar that indicates the progress through the selected archive databases.
Occupancy Report Options
Frequency Start
Type in the Start Frequency. Press “k” (kHz), “M” (MHz), or “G” (GHz). Range is 9 kHz to maximum range of measuring instrument up to 54 GHz.
Frequency Stop
Type or enter the channel Stop Frequency. Press “k” (kHz), “M” (MHz), or “G” (GHz). Range is 9 kHz to maximum range of measuring instrument up to 54 GHz.
Power Threshold
Type in the Power Threshold. (dBm)
Channel Width
Type in the Channel Width. (kHz)
Vision Report Folder
Click to view folder where reports are archived.
Report Header
Check to append a custom header to the report output. Type in the custom header.
Report Footer
Check to append a custom footer to the report output. Type in the custom footer.
Export Field Delimiter
Comma
Export file field separator.
Semicolon
Export file field separator.
Tab
Export file field separator.
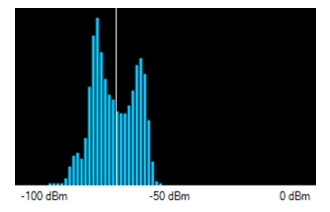
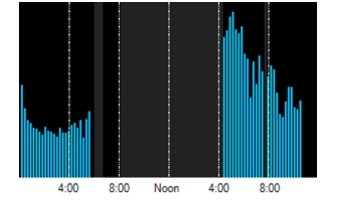
Power Histogram
Below the folder list in the lower-left corner of the program window there is a graph that will show either a histogram of the power at the selected sub-channel as shown in Figure: Power Histogram of Selected Sub-Channel, or a histogram showing the time-of-day power readings for the selected sub-channel as shown in Figure: Time-of-Day Power Histogram. The gray shading indicates there is no data available during that time. If it is black, no shading and no bar, then there are traces at those time, but everything was below threshold. You can toggle between these two views with the Power and Time Of Day buttons below the graph. There is also a Copy button that will place the graph onto the Windows Clipboard.