Displays all of the traces collected from the 12 channels of the selected base station. The trace displayed in the Current Trace Panel is indicated by the short white line at the left edge of the display panel. See Figure: Spectrogram. To view the short white line indicator:
1. Click Alt while the mouse is over the spectrogram displays a line across the spectrogram at the position of the currently selected trace.
2. Click Ctrl while the mouse is over the spectrogram displays a line across the spectrogram at the position of the mouse cursor, therefore illustrating the trace that would be selected when clicking. If the number of traces exceed the display, a scroll bar will appear on the right that will allow you to view all of the traces.
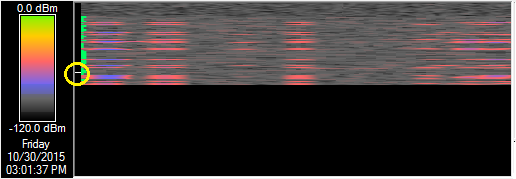
A power range color indicator resides left of the spectrogram which defines the trace colors in the spectrogram. A day, date, and time stamp will display under the power range color indicator for a trace that the cursor points to in the spectrogram.