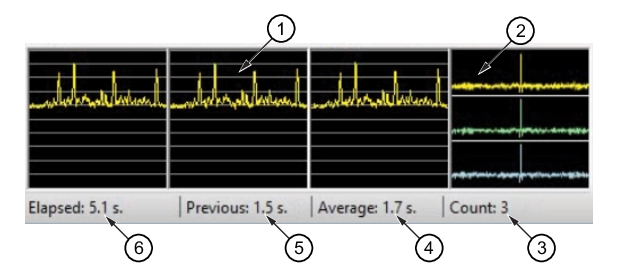
IQ signal correlation for each set of receivers. The prominence of the peak above the baseline is a good indication of the quality of a particular measurement. Top chart is a graph of the correlation between monitors 1 and 2. Middle chart is for monitors 1 and 3. Bottom chart is for monitors 2 and 3.
Average Count
Due to the uncertainty in each position estimate, several sequential measurements and average the results are performed. This is the number of measurements in the current result.
Average Time
The average time for each IQ capture and position calculation.
Previous Time-to-Measurement
The time the most recent measurement took. If this number gets very large, one of the receivers might be off-line.
Total Time
The total time taken for the set of measurements in the current result.