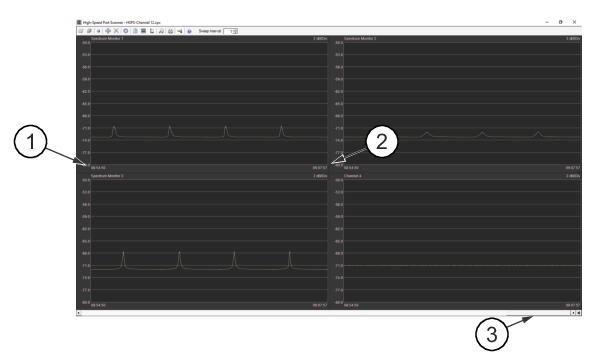
The RSSI PvT (Power vs. Time) graphs plot the Channel Power from each trace. Figure: PvT Plots shows four traces in PvT mode display. As the traces sweep, the graph fills slowly from the left to right as each trace sweep data is captured.
PvT Plots
1. Time-of-Day Readout
2. Time-of-Day Current Readout
3. Scrollbar
“RSSI (P vs T) View”
The PvT graph will accumulate up to 3600 points per plot. The time-of-day readouts continuously track the trace as it scrolls from left to right. The PvT will continue to collect points, replacing the oldest points as new ones come in – always adding values to the right. It is likely that some Remote Spectrum Monitors will be slower, or be used to scan more channels than others, so the number of points do not necessarily match.
There is a scrollbar at the bottom of the PvT plot screen. Moving this allows the user to see values that have scrolled off of the screen.
The scrollbar position indicates a time for the center of each graph. Because graphs may have different numbers of points, the time markers may not match. The goal when scrolling is to look at a common time, so each will be centered as near as possible to a common point in time.