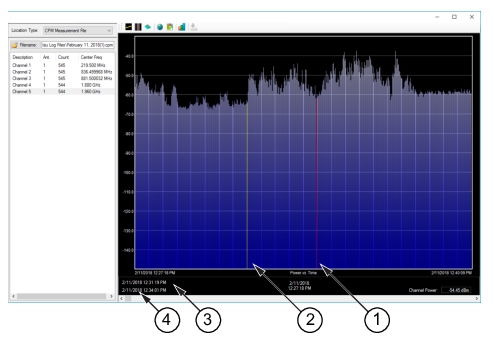
The Power vs Time chart provides a date/time occurrence readout of a selected power level within a swept spectrum. In the example shown in Figure: Power vs. Time Markers, two markers are positioned with the date/time occurrence for each marker displayed at the lower left corner of the display.
To mark and display the date and time of a power level occurrence, move the mouse cursor over the Power vs. Time plot to track the power level date/time occurrence in the lower left corner of the window. Clicking on the plot sets a persistent first marker, colored yellow on the bar chart. The date/time value of this positioned marker is displayed in the marker text. With one marker set, continue to move the cursor over the plot and click again to set a second (red) marker. The marker date/time occurrence at the second line reflects the second persistent marker. This allows the user to see the date/time when events occur in the data set and to see a time span between power events, such as a signal turning on or off.
Clear the Power vs Time Markers
The markers can be cleared in one of two ways. Clicking on the marker text clears the persistent nature of that marker. Click Escape clears the 2nd marker, if set, or the first if the 2nd is not set. Double-click Escape twice clears both markers.
Power vs. Time Markers
1. Marker 2 (Red)
2. Marker 1 (Yellow)
3. Marker 1 Time Stamp
4. Marker 2 Time Stamp
Marker
To add a marker on the channel trace, move the mouse over a point on the sweep and click to display a marker.
Delta Marker
To add a delta marker on the channel trace, move the mouse over a point and click. You will see a blue Marker appear. Note that a Delta Marker can be selected “After” a marker has been placed in the Trace. The Delta Marker refers to the relationship with the next selected spot and the green marker that has been placed.
Channel Power
An occupied bandwidth is determined as the region that contains 99 % of the power. The Channel Power is the power in that bandwidth.
Delta Marker check box
Removes the Delta Marker from the trace display.
Marker check box
Removes the Marker and Delta Marker from the trace display.
Add and Remove Markers.
1. Add a marker and/or delta marker by pointing on the desired frequency and click.
2. Remove the markers by clicking at the left bottom corner of the display. The values of the Occupied Bandwidth (OBW) and Channel Power are displayed at the bottom right corner.