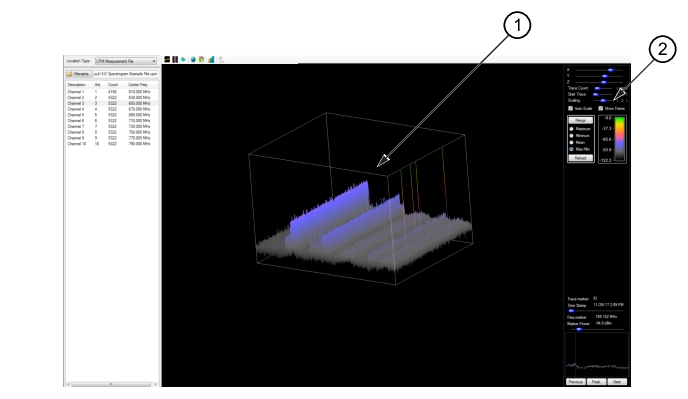
3-D Spectrogram View
3-D Spectrogram view provides a 3-D Spectrogram view of the selected trace(s) as shown in
Figure: Spectrogram View.
The Spectrogram View Control Panel provides the tools analyze the Spectrogram display. The control panel consists of:
• XYZ control
• Trace Count
• Start Trace
• Scaling
• Auto-Scale check box
• Show Frame check box
• Trace Merge Components of Maximum, Minimum, Mean, Max/Min, and Reload
• Spectrogram power level legend
• Trace marker indicator
• Trace Time Stamp
• Frequency marker readout
• Marker Power readout
• Spectrogram peak search with choices of: Previous, Peak, and Next