An occupancy report divides up a frequency range into sub-channels and shows the typical traffic at each sub-channel frequency. Occupancy reports are:
• Typically used to investigate the availability of bandwidth within a particular frequency space or to locate unexpected signals in the frequency space.
• Generated from several hours, days, or weeks of continuous spectrum monitoring data.
• May span multiple databases.
Determine the frequency range of interest and then collect trace data in that frequency space. The spectrum analyzers can collect up to 4000 points per trace. You will need to set the number of points such that you have at least one point/sub-channel. If you have more than one point/sub-channel, the highest measured power in the sub-channel is used in the report. For instance, if you are interested in monitoring the 500 MHz to 600 MHz, and you want 25 kHz channel spacing, then you will need at least (600 MHz – 500 MHz)/25 kHz = 4000 trace points.
Occupancy Report Generator works with auto-archived databases or manually created Vision database. To begin with select Open Folder Location from File menu. You can also select Recent Database Locations to quickly choose a desired folder location. Choose an already saved database file from the selected location in your computer and click OK button.
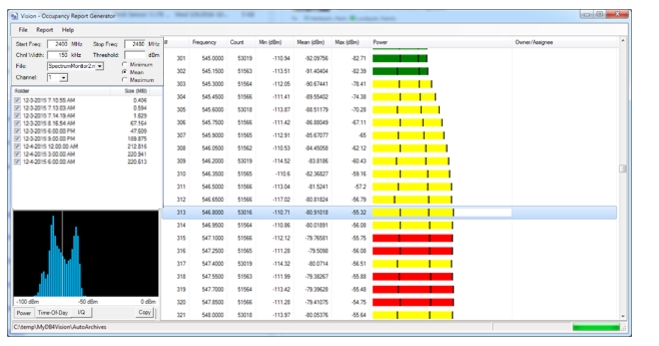
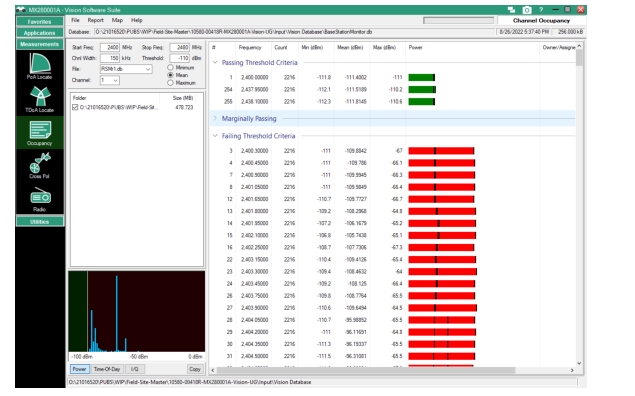
Note that each folder is listed by name or location under Folder section. Make sure to check/uncheck the check box next to the folder to include or exclude particular folders in the generated report. Specify the folder location that holds the desired database by selecting an appropriate .db file from File drop-down menu included in the Channel Setup Parameters section. Refer to Figure: Occupancy Report. Auto-archived databases are stored in a sub-folder of the active database folder. Each archived database has its own sub-folder, named with the date and time stamp at which the archive was created. The databases will be listed on the left side of the report generator window.
Finally, to generate the Occupancy Report, click Generate from the Report menu on the Occupancy menu bar, or press F5 as a shortcut. It may take several seconds to generate the report, depending on the number of traces and archive folders being processed. There can be a lot of data to process. The upper right-hand corner of the window has a progress bar that indicates the progress in green through the selected archive databases. See Figure: Occupancy Report.
The report includes Frequency, Count, Minimum, Mean and Maximum channel power values. The color-coded Power bars have following significance:
Green: Maximum power measured in a sub-channel is below this threshold, the channel passes.
Yellow: Maximum power exceeds the threshold, but the average power is below the threshold.
Red: All saved traces in a given sub-channel is above the threshold.
The power bar for each sub-channel also shows three vertical black lines. The first is the minimum power measured, the second is the mean power, and the third is the maximum power measured for the given sub-channel.
Occupancy Report
Owner/Assignee
The last column in the Occupancy Report shows the assigned owner’s name for each sub-channel. This is for reference. This column can be edited by clicking in the column and typing the desired information. An Owner List must be loaded each time you generate a report, as the report comes directly from the database, which does not contain information about channel assignments or ownership. To load Owner/Assignee list go to File menu and select Load Owner/Assignee List. If you have edited the owner/assignee list in the currently generated Occupancy Report, be sure to click Save Owner/Assignee List from the File menu before closing the window or generating a new report, otherwise, your edits may be lost.
Setting Channel Setup Parameters
Start Freq
Type in the Start Frequency. Press “k” (kHz), “M” (MHz), or “G” (GHz). Range is 9 kHz to maximum range of measuring instrument up to 54 GHz.
Stop Freq
Type or enter the channel Stop Frequency. Press “k” (kHz), “M” (MHz), or “G” (GHz). Range is 9 kHz to maximum range of measuring instrument up to 54 GHz.
Chnl Width
Type in the Channel Width (kHz).
Threshold
Type in the Power Threshold (dBm).
File
Displays the selected database file.
Channel
Lists the channel number out of total number of channels.
Minimum
Select this radio button to display the sub-channels based on minimum power per set Threshold value.
Mean
Select this radio button to display the sub-channels based on mean power per set Threshold value.
Maximum
Select this radio button to display the sub-channels based on maximum power per set Threshold value.
Folder
Displays the selected folder location.
Histogram
There are 3 types of histograms that are supported by Occupancy measurement. These graphs are located right under the Folder check box in the lower left side of the window.
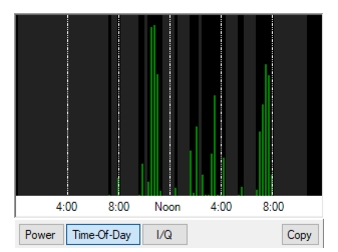
Click Time-Of-Day button to view the histogram of the time-of-day power readings for the selected sub-channel as shown in Figure: Time-of-Day Power Histogram. The gray shading indicates there is no data available during that time. If it is black, no shading and no bar, then there are traces at those time, but everything was below threshold.
Click I/Q button to view the
Click Copy button to replicate the graph onto the Windows Clipboard.
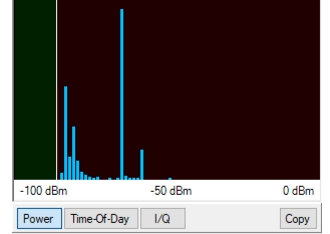
Power Histogram of Selected Sub-Channel
Time-of-Day Power Histogram
IQ Histogram
Under the Report menu there are two options for exporting the report to a standard disk file, as follows:
Export to Browser
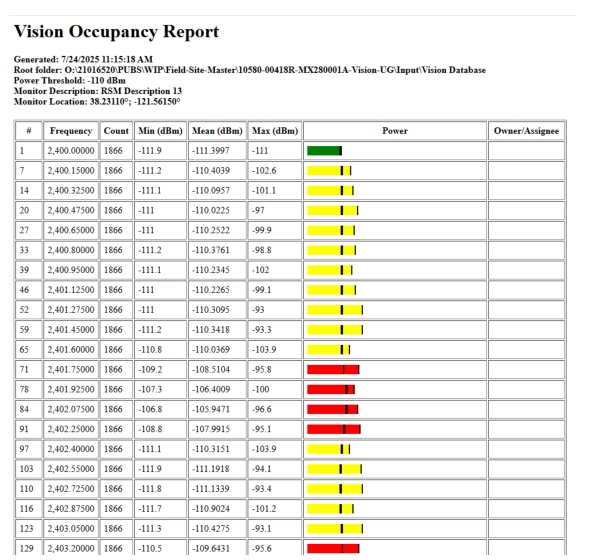
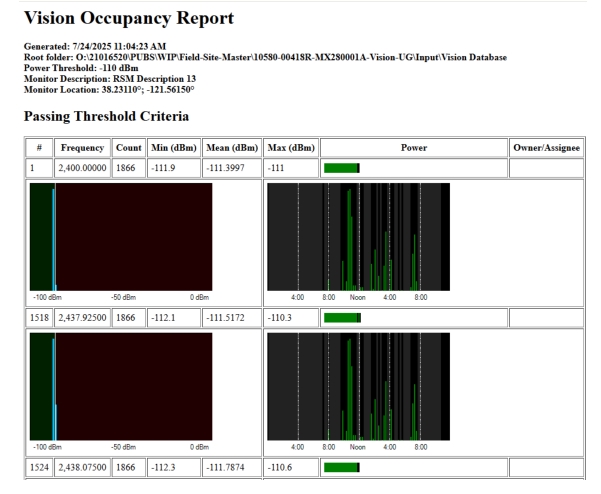
Opens the Save As dialog to save the created HTML file to the desired folder. Then the file will open in the default web browser. This is a convenient way to store reports so that they can be called up and reviewed at later times. The Report Generator does not have an internal Print function, so hard copies are most easily generated by exporting and printing from the web browser. See Figure: Export to Browser (HTML).
Export to Browser (HTML)
Export to CSV
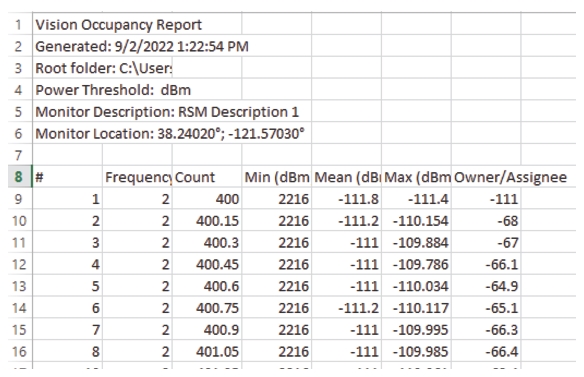
Opens the Save As dialog to save the created .csv file to the desired folder. Click Save immediately saves the file to the desired folder. To view the CSV file, import the report into a spreadsheet such as Microsoft Excel. See Figure: Export to CSV Report.
Export to CSV Report
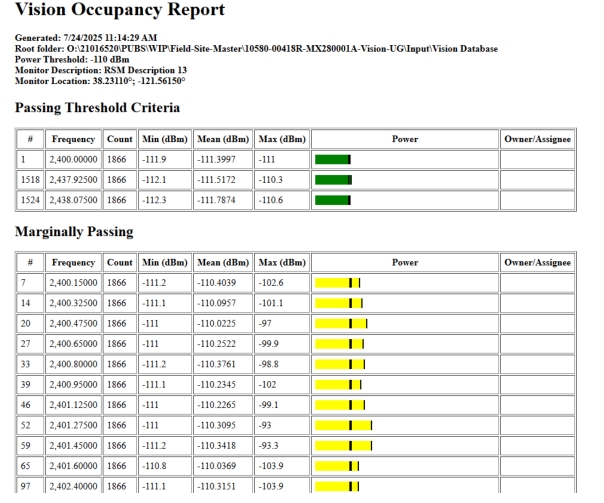
Grouping Sub-Channels
Normally, the occupancy report will include the sub-channels in frequency order. To group the sub-channels by pass/fail status select Show By Pass/Fail Status under the Report menu. The channels with power levels within the set threshold values appear on the top indicated with green bars. Followed by marginally passing sub-channels indicated by yellow bars and failing threshold sub-channels indicated by red bars as shown in Figure: Occupancy Report Sorted Pass/Fail, Marginally Passing Section Collapsed.