 |
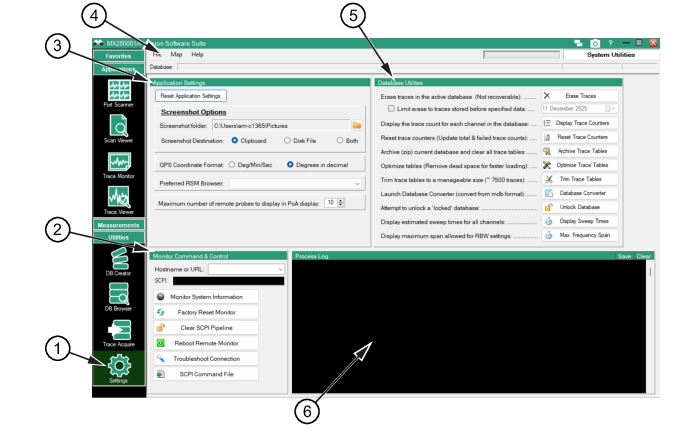
1. Settings Menu 2. Monitor Command and Control 3. Applications Settings 4. Menu Bar 5. Database Utilities 6. Process Log |
|
1. Settings Menu 2. Monitor Command and Control 3. Applications Settings 4. Menu Bar 5. Database Utilities 6. Process Log |
Menu | Description |
File | Open Database Opens the database folder that has been set from “Set Database Root Folder”. Set Database Root Folder Sets the root folder of the database. Recent Databases Click to display the most recent databases used. Exit Exit the File menu. |
Map | Load Map Load a customer selected map to the screen. Existing Maps Load a map from an existing map folder. |
Help | Help See Help Menu. |
Icon | Description |
Reset Application Settings Reset all program configuration and settings values to default values. | |
 | Screenshot folder Open the folder icon to browse and to set the screenshot folder. Default is the Pictures folder. Screenshot Destinations Set the radio button to select the screenshot destination. • Clipboard: Screenshots will be placed in the Windows clipboard. • Disk File: Screenshots are saved to a disk file (time stamped names are used). • Both: Screenshots will be saved to both the Windows clipboard and a disk file. |
Deg/Min/Sec Shows GPS coordinates in Deg/Min/Sec format. Degrees in Decimal Shows GPS coordinates in Decimal format. | |
Preferred RSM Browser This setting refers to opening the RSM remote interface. Set as Google Chrome, Firefox, or Microsoft Edge and includes all web browsers installed on the user's PC. HTML content will ignore this setting and be opened with the user's default browser as set in Windows. | |
Maximum Number of Probes The number of probes set determines the number of probes available for the PoA menu. |
Icon | Description |
Hostname or URL Type the Hostname or URL. SCPI Enter SCPI command for direct command and response. | |
Monitor System Information Display basic monitor information, including firmware version and installed options. | |
Factory Reset Monitor Factory reset the active spectrum analyzer. | |
Clear SCPI Pipeline If SCPI stops responding, this may restore communication by clearing the communication channel. | |
Reboot Remote Monitor Reboot the remote spectrum analyzer. | |
Troubleshoot Connection Click to test the monitor connection. The result is shown in Process Log. | |
SCPI Command File Load and process a SCPI command file |
Icon | Description |
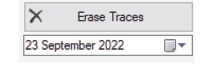 | Erase Traces Erase traces in the database. This leaves the database empty as though newly created. Data is not recoverable. Before Date Set a date to erase traces from the active database. |
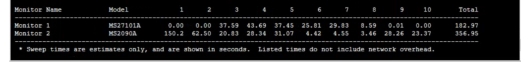
Display Trace Counters Display the trace counters for each monitor in the active database. | |
Reset Trace Counters Resets the trace counters of each monitor in the active database. | |
Archive Trace Tables Store active database in an archive (*.zip) file, erase all trace data, and reset. | |
Optimize Trace Tables Optimize the active database. This removes wasted space and compresses the database file. | |
Trim Trace Tables Remove old traces from the active database. | |
Database Converter Launch Database Converter to convert from older Vision Format. | |
Unlock Database Attempt to unlock a ‘locked’ database. | |
Display Sweep Times Displays in the Process Log window the maximum frequency span for each normal value of RBW. | |
Max. Frequency Span Provides a Frequency-Span-Sweep Time conditions table in the Process Log window. SeeMaximum Frequency Span. |
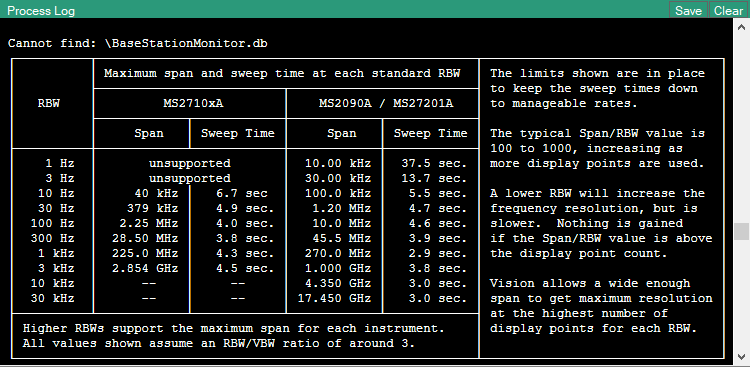 |
Note | You can save the process log contents as a log file by clicking the Save button on the top right corner as shown in Figure: Maximum Frequency Span Table. To delete the log simply clicking Clear button next to the Save button. |
 |