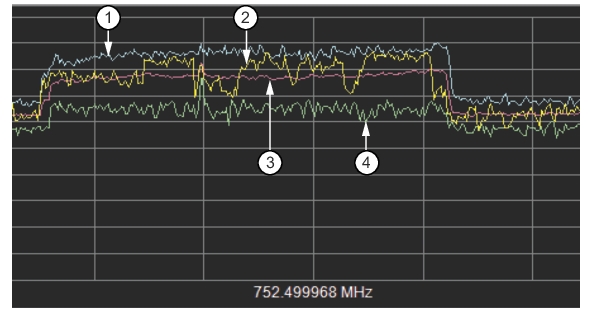
Figure: All Traces View shows a Single Trace view with Max Trace, Min Trace, and Average Trace active.
All Traces View
1. Max Hold Trace (Light Blue)
2. Single Trace (Yellow)
3. Average Trace (Magenta)
4. Min Hold Trace (Light Green)
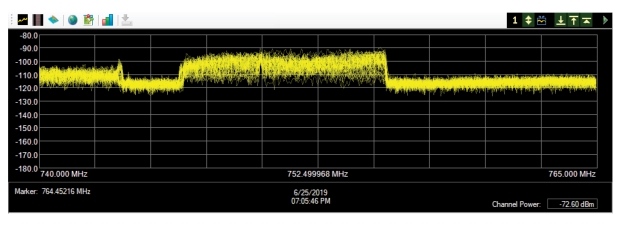
Figure: Density Plot shows the density plot of the Single Trace shown in Figure: All Traces View. The plot displays all the single spectrum analyzer sweep traces saved and then superimposed in one display.