Channel Scanner Measurement Guide : Channel Scanner Measurements : SETUP Menu (Mapping View)
 
SETUP Menu (Mapping View)
This setup menu is unique only to Mapping view. To select mapping view from main menu press MEASURE > VIEW > Mapping.
Note 
Coverage Mapping Option 431 is required to access mapping view in channel scanner measurement.
SETUP Menu (Mapping View)
 
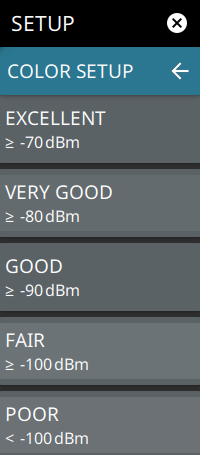
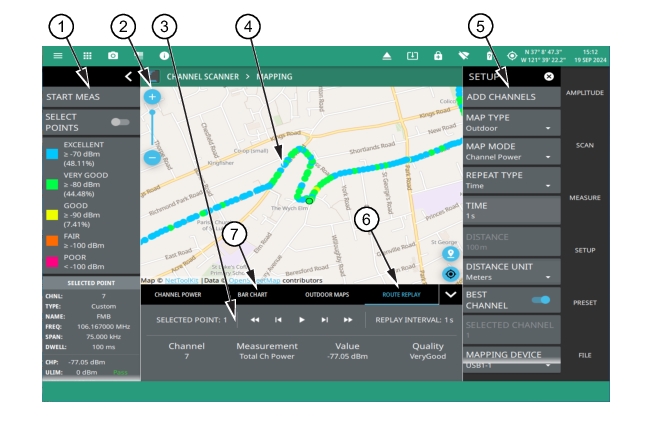
ADD CHANNELS
Adds a signal standard or a custom frequency measurement channels.
MAP TYPE
Selects indoor or outdoor coverage mapping:
Indoor: The indoor map type is used to select the image/map for mapping from the instrument File system. This image is usually a building floor plan or campus layout drawing.
Outdoor: The outdoor map is used to view the signal strength within a selected region of the outdoor map.
MAP MODE
Selects the measurement type for the map:
Channel Power: The total power within the set channel bandwidth (SPAN).
REPEAT TYPE
Selects when a map data point is recorded. The repeat type can be set to a time interval or distance interval. For indoor coverage mapping, time interval will evenly distribute measurement points between two selected positions; distance interval will plot a single point for every position selected by the user.
TIME
When the repeat type is Time, sets the time duration for recording map data points.
DISTANCE
When the repeat type is Distance, sets the distance between recording map data points. When using an indoor map type, the distance mode only marks the data points to where the user drags the location pin.
BEST CHANNEL
Displays the best channel with highest possible quality indicated by the color of map points. Go to ROUTE REPLAY tab to view the channel quality, number and channel power value.
SELECTED CHANNEL
Enters the desired channel. The maximum number of channels supported are 60 and minimum is 1. Note that SELECTED CHANNEL is disabled when BEST CHANNEL is turned on.
DISTANCE UNIT
Selects distance units of Meters or Feet
COLOR SETUP
PRESET SETUP
Sets all coverage mapping setup parameters to default, including color setup.
COLOR SETUP Menu (Mapping)
The channel scanner measurement COLOR SETUP menu is available in main menu SETUP > COLOR SETUP.
COLOR SETUP Menu (Mapping)
 
EXCELLENT
Sets the power level threshold for the EXCELLENT color.
VERY GOOD
Sets the power level threshold for the VERY GOOD color.
GOOD
Sets the power level threshold for the GOOD color.
FAIR
Sets the power level threshold for FAIR color.
POOR
Sets the power level threshold for the POOR color.
See Outdoor Coverage Mapping for the color-coded legend.
Outdoor Coverage Mapping
With a valid GNSS (GPS) signal, the instrument identifies the current location on the displayed map with a location pin. As the location changes during a measurement, colored-coded dots corresponding to the received signal strength/power are placed at distance or time intervals. Using GNSS (GPS) for latitude, longitude, and altitude, data is automatically saved for each location. The instrument logs data automatically based on either a set time or distance interval. If there is no map available when making the measurements, it is still possible to save all of the data to a KML file and then combine the data with a map using other third party tools that can work with KML data. You may also recall a map after taking the data without having to save and recall the measurement data. See Figure: Coverage Mapping (Outdoor) for an overview of the outdoor coverage mapping interface.
Note 
Outdoor coverage mapping capability is not supported if the instrument is not connected with a GNSS antenna or GNSS/GPS toggle is turned off. A warning message will then be displayed on the title bar, that indicates GPS antenna is required to perform outdoor mapping.
When saving CSV and KML map point measurement data files, the saved data is cumulative of all data points on the map or measurements since the map points were last cleared.
Coverage Mapping (Outdoor)
1. The coverage mapping status panel provides quick access to common settings and allows you to start and stop a coverage mapping measurement. A color-coded signal strength legend including the corresponding percentage values are also displayed. See Status Panel (Mapping View).
2. Select map zoom tool to increase (+) or decrease (-) zoom level. You can also drag the zoom level indicator up or down, or you can pinch to change zoom level.
3. Tabular section displays the following three measurement sections:
Channel power measurement tab includes the total number of points, average, minimum and maximum values.
Bar chart tab displays the mini version of the bar chart view. Note that maximum number of channels supported are 60.
Outdoor maps tab lists all the previously added outdoor maps and + ADD MORE MAPS button used to add more outdoor maps.
Route replay tab consists of either the selected channel or best channel, channel power value and signal quality. It also includes navigation controls displayed as arrow heads used to play/pause the replay, either move up/down a single data point or in increments/decrements of five.
4. The map display area shows map data for the current area and color-coded dots corresponding to the signal colors that are set up for the recorded measurement data. Refer to
5. Select SETUP menu to configure coverage mapping measurement settings. See SETUP Menu (Mapping View).
6. Route replay allows you to play/pause the coverage area highlighted with colored data points.
7. Bar chart shows length for both imperial (miles) and metric (kilometers) units.
Indoor Coverage Mapping
Indoor coverage mapping does not use a GNSS (GPS) signal to identify the current location, but rather relies on the user to touch the location pin to where they are located on a building floor plan, or map, that is shown on the instrument display. As the location pin is moved from point to point during a measurement, the map is annotated with dots that are colored-coded to the received signal strength/power. The instrument logs data automatically based on either a set time or distance interval. You may save and recall the measurement as a PNG file or save just the measurement data. See Figure: Channel Scanner Indoor Mapping for an overview of the indoor coverage mapping interface.
Channel Scanner Indoor Mapping 
1. The coverage mapping status panel provides quick access to common settings and allows you to start and stop a coverage mapping measurement. A color-coded signal-strength legend is shown at the bottom of the panel. See Status Panel (Mapping View).
2. Tabular column below shows the channel power measurement, bar chart, indoor maps, and route replay tabs.
3. The map display area shows map data for the current area and color-coded dots that correspond to the signal colors that are set up for the recorded measurement data.
4. The SETUP menu is where the coverage mapping measurement settings are configured. See SETUP Menu (Mapping View).